

No hatchling can fly unless it takes the first bold step out of its shell.
The flight follows the first step.
Just like the hatchling, those amongst us who do make it to the big league, achieve it by stepping out of our comfort zones.
Wall Street is one such playing field that promises growth and prosperity, provided we heed its call to invest intelligently and insightfully.
Our modern world, bound by the common thread of blisteringly fast communication, has reduced physical distances to naught.
Investing in the US markets from anywhere in India is now a reality, and more and more investors are taking their first step towards diversifying their portfolios by investing in the US.
The progression is natural and keeping with the new age: We have progressed from holding cash in savings accounts and FDs to investing in Indian listed companies. Now, many of us are tapping into the global ebb and flow of finances, and becoming a part of the global narrative.
Let’s find out more.
First, of course, is the benefit of diversification. Consider the following example.
You’ve created an extensive portfolio with the top-performing Indian equities and mutual funds. You’ve diversified across the different sectors, and even across the different market caps.
You’re in a good place. Or are you?
Markets have a long history of booms and busts. Time and again, Indian markets have borne the brunt of rattling corrections. Be it the Covid-19 scare or the fallout from demonetisation or the persistent fall in the Indian markets as seen during 2015-2016 — one can keep going back in time, and find that every bullish wave is followed invariably by a bearish one.
Your portfolio can take a hit if it is diversified only within the Indian market. This is where having allocation towards US equities can act as a hedge against the domestic market fall.
It ties back to Nobel Prize laureate Henry Markowitz’s modern portfolio theory — “Diversification is the only free lunch in investing”. The objective is to create a portfolio with different assets that don’t show correlation. If one moves to the right, the other should move to the left, and vice versa.
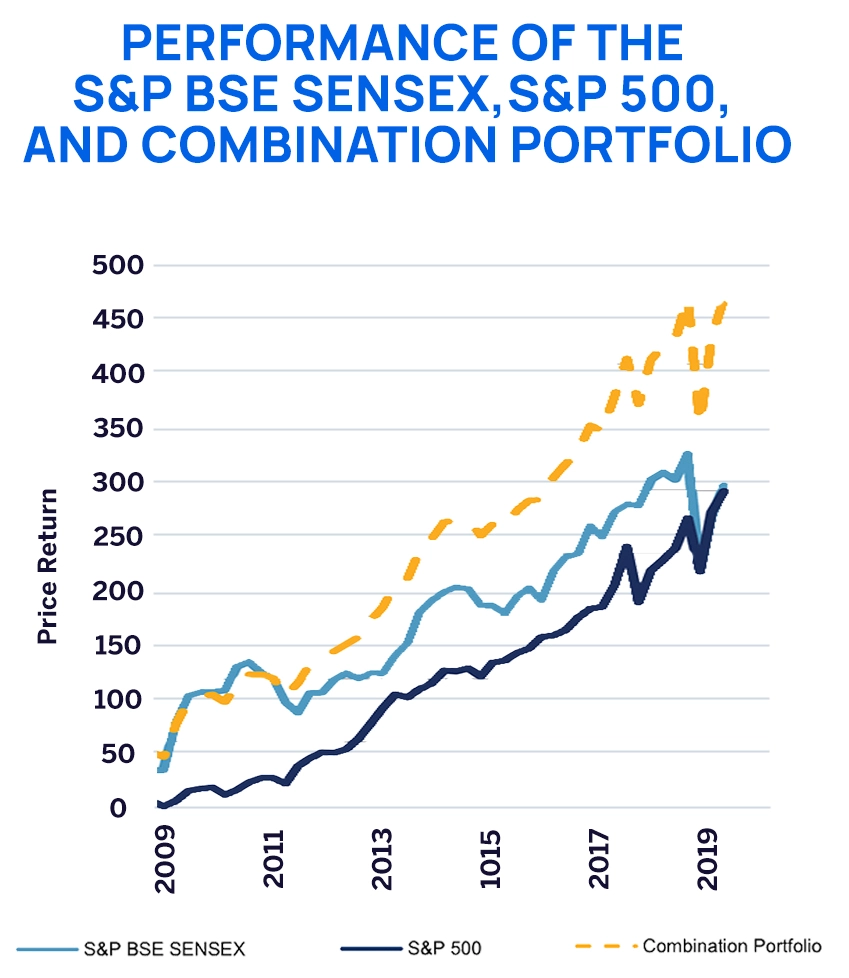
Let’s compare the performance of non-diversified and diversified portfolios during recent economic downturns in India:
The Indian stock market experienced significant volatility due to capital outflows and currency depreciation, with the Sensex dropping around 10% over a few months. In contrast, the S&P 500 fell by about 8%.
In November 2016, the government demonetised Rs. 500 and Rs. 1,000 notes. In response, the BSE Sensex dropped by 1,689 points or 6.12%. During the same period, the S&P 500 grew by about 119 points or 5.7%.
The BSE Sensex dropped by about 33% from its peak in January 2020 to its trough in April 2020. The S&P 500 also saw a decline of about 31.8% during the same period. However, the subsequent recovery in the US market was faster, with the S&P 500 regaining its losses by August 2020, while the Sensex took longer to recover.
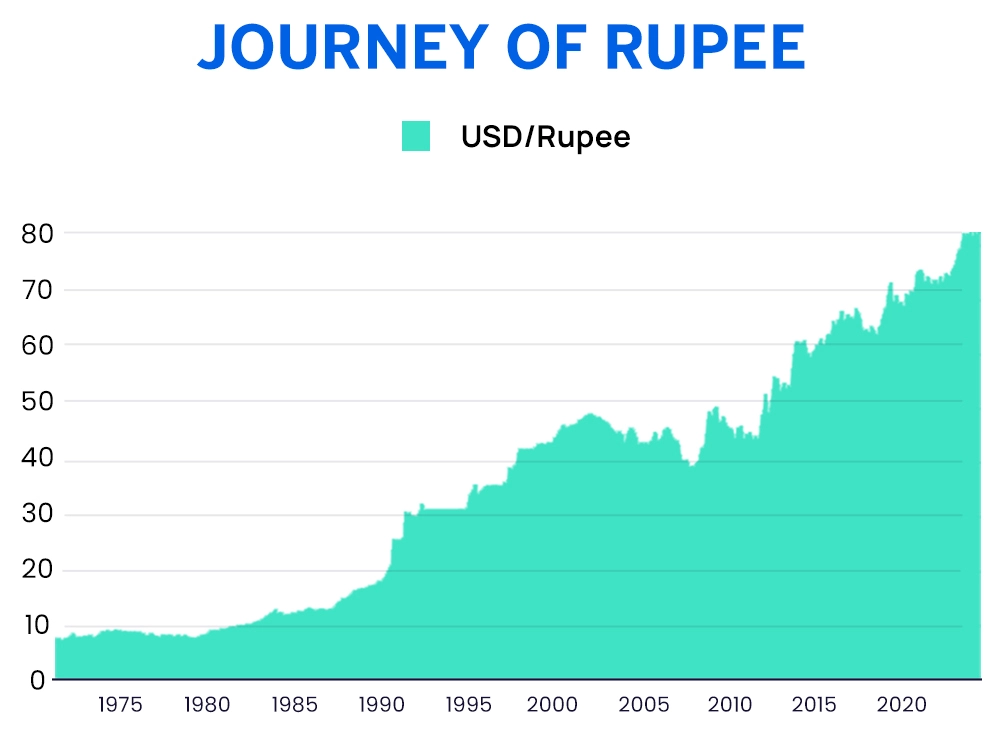
There’s also the benefit of dollar appreciation against the rupee.
If there’s one thing that seems to be on a steady downward trajectory, it is the value of the rupee against the dollar. Historical trends show that the US dollar tends to appreciate over time due to the strength of the US economy and its status as a global reserve currency.
Uncertainties in the global markets? USD-INR rises.
Indian economy stumbles? USD-INR rises.
Crude oil becomes more expensive? USD-INR rises.
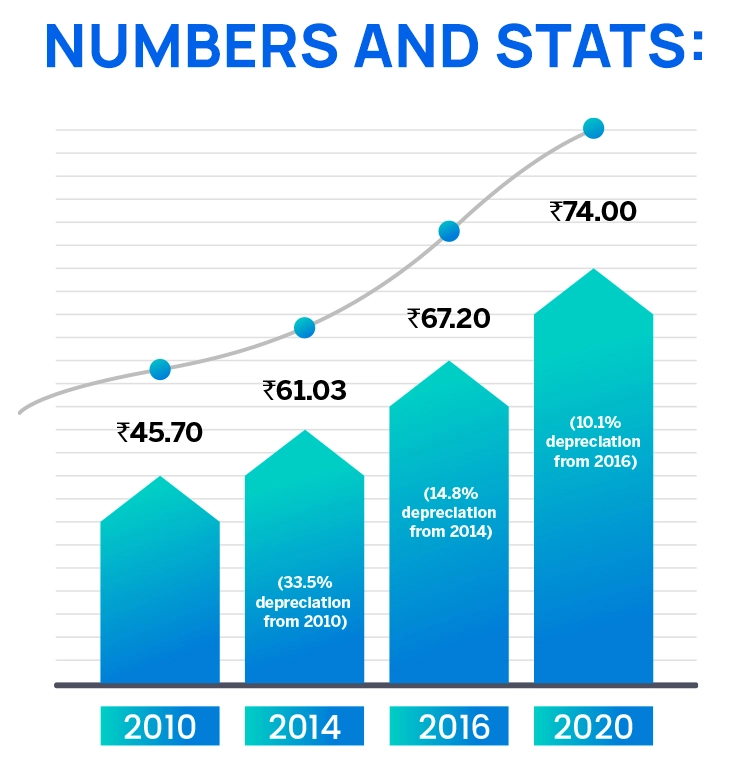
Here’s a detailed look at the rupee’s depreciation against the dollar over the past decade:
Between 2010 and 2020, the Indian rupee depreciated significantly against the US dollar:
Now, at first glance, this depreciation may seem like it’s going downhill. And it is, in certain aspects. The value of the Indian rupee is certainly falling in comparison to the dollar.
But, if you’re investing in US stocks, this opens up a whole other outlook — you can leverage this dollar appreciation to increase your profits.
Think, for instance, that you had invested $10,000 in US stocks in 2010.
Unless you had selected the stocks that performed poorly, high chances are, the values would have increased significantly by now.
But, even if we assume that the value of the stocks remained constant, the mere depreciation of the rupee from 45.70 to 74.00 would increase the investment value in INR from ₹4,57,000 to ₹7,40,000 by 2020!
So while USD appreciation is good for your US portfolio, how easy is it to start?
Till recently, it was difficult for retail investors to participate in the US markets. An investor had to go to their bank, fill out an A2 form, identify and sign-up with a brokerage firm abroad, and then pay anywhere between Rs. 500 to Rs. 1,500 for the wire transfer, on top of dealing with the back and forth with a bank on remittance processing.
Would you have been able to invest with such ease?
Investing in the US has become easier under the LRS (Liberalised Remittance Scheme). Indian residents can remit up to $250,000 per financial year for various purposes, including investing in foreign stocks and bonds. New companies like Appreciate have made the process of investing in the US seamless and affordable for Indians.
According to RBI,
Under the Liberalised Remittance Scheme, any resident in India can send up to USD 250,000 abroad each financial year. The money can be sent for personal reasons, investments, or both.
India’s outward remittances have been growing at an unprecedented pace. They hit a peak of $31.73 billion in FY24, up 16.91% Y-o-Y.
Of course, this doesn’t mean the entire amount is going into US equities. Indians are also spending equally on travel and overseas education.
But the amount spent on equity and debt investments has also risen considerably. It grew by 20.29% in FY24 to reach $1.51 billion.
More and more Indians are participating in the US stock markets. So, the next question is, how big is the opportunity?
“The American Dream is that dream of a land in which life should be better and richer and fuller for everyone, with opportunity for each according to ability or achievement.” — James Truslow Adam
The US has long been associated with dreams, ambitions and equal opportunity for all. That’s why folks from all over the world are drawn to this country, reaffirming the US' reputation and fabled story as the “The promised land”.
As for Wall Street, it has, in the past few decades, emerged as singular hotspot for the world’s finances, effectively scripting the industrial, infrastructural and commercial paradigm of tomorrow. What the future holds in store can be guaged by the market trends of Wall Street today. Wall Street occupies a vantage position, not just in terms of being one of the largest markets in the world, but also because of the scope and vision of the market bigwigs.
Juxtapose the Indian markets with the US markets: The total market cap of the BSE is about $5 trillion. But the total market cap of the US stock market is $50.8 trillion! The market cap of some of the biggest US companies beats the GDPs of some countries like France and the UK.
Let’s now delve deeper into the opportunity.
The US GDP grew by 1.4% in the first quarter of 2024, following a robust 3.4% increase in the fourth quarter of 2023. The economy is expected to grow at a rate of 2.2% in 2024, although some forecasts predict a slight deceleration due to monetary policy adjustments and geopolitical factors.
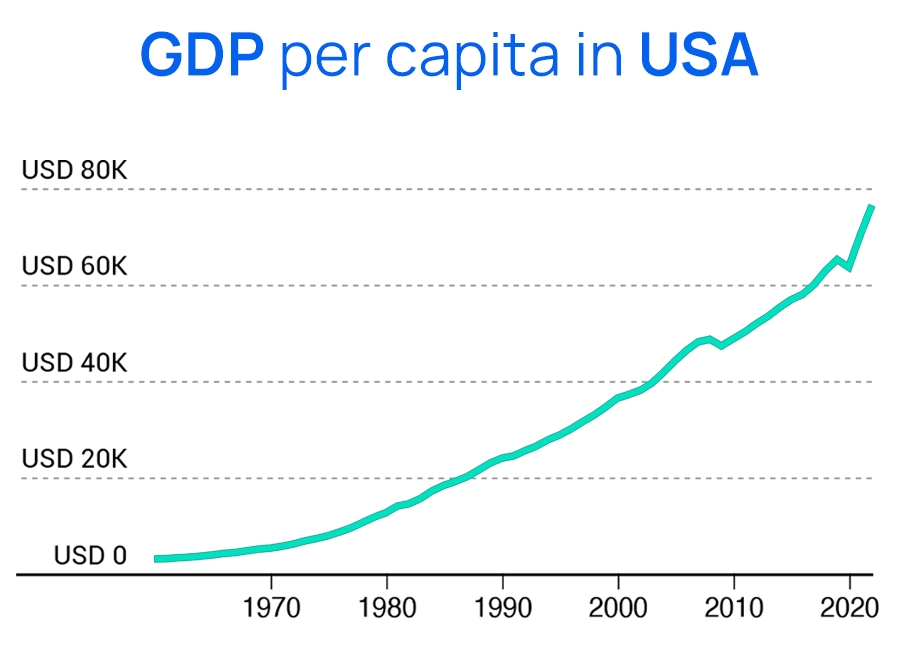
The growth rate is slower than what we have in India, but that’s only because it’s already reached a certain level of development. As long as the growth rate is positive, (which it likely will continue to be), it’s a positive sign.
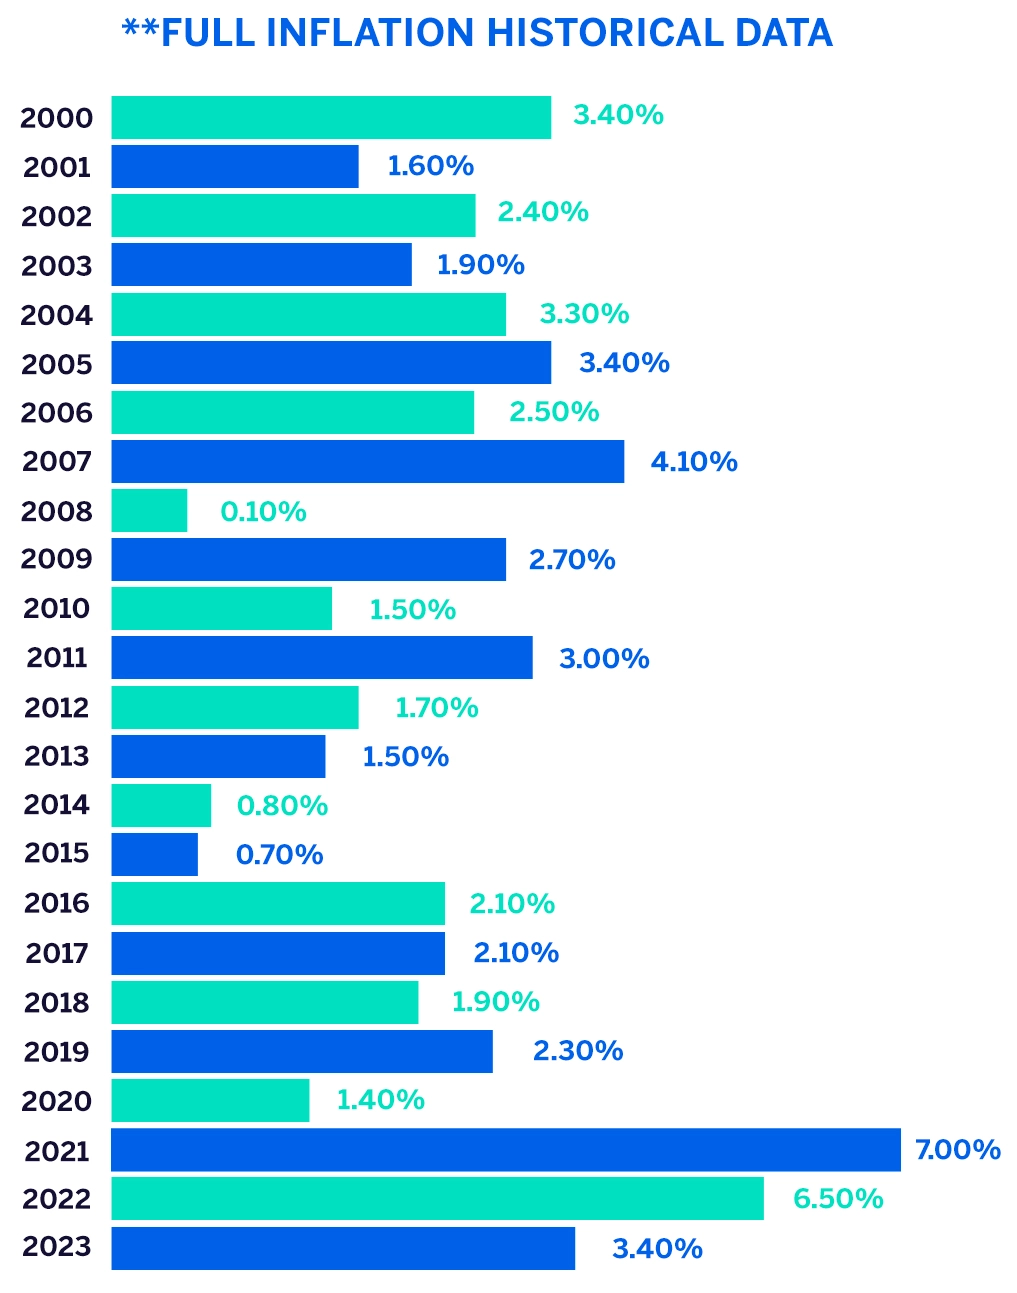
Inflation has been a concern for most countries ever since the COVID-19 pandemic and the subsequent troubles that followed. Most of the world is still reeling from the aftereffects, and it is only now that we are starting to recover.
Now, generally, an inflation rate of about 2% is considered to be healthy for the economy.
Conventionally, the US Fed aims for a gradual increase in prices in the long run. The belief is that a slowly increasing price level keeps companies profitable. Apart from that, it also encourages customers to keep buying and not wait for a price drop.
In 2021, inflation blew up and touched 7%. To put this in perspective, in 2020, average inflation was at 1.40%. You can just imagine how high this jump was.
This triggered the Federal Reserve into action. The central bank began its crackdown on mounting inflation and started ramping up interest rates, in hopes of bringing down inflation that was operating at a 40-year high.
As of July 2024, interest rates in the US are at a 22-year high. The woes of increased interest rates, aside, the bitter medicine seems to be working its charm.
The Federal Reserve seems to be winning the battle against inflation, and as of June 2024, the US inflation stood at 3%.
As inflation falls, the Fed will also start reducing interest rates to encourage more credit. The trick is to maintain the balance — interest rates need to be low enough so that companies don’t hesitate to take loans for productive activities. But, on the other hand, it should also not be so low that consumers decide it’s better to spend than to save at all.
No one can miss the trending AI rally that’s taking the US markets by storm right now
In a remarkable turn of events, Nvidia has emerged as the unrivalled leader in the AI space and achieved a market valuation of $3.34 trillion. In the first quarter of FY2025, Nvidia’s revenue reached $26 billion, up 262% from the previous year. In the span of the last year alone, the chip manufacturer has delivered returns of a whopping 148%. There are other lesser known companies and emerging companies in this space that will continue to drive the rally.
COVID-19 is well and truly over. The world is shaking off the lingering aftereffects and preparing for the next bull run. The US markets are no different.
Cautious optimism is the name of the game right now. While there are bullish trends driven by technological advancements and strong corporate earnings, there are also concerns about inflation, geopolitical risks, and potential economic slowdowns. Overall, the market appears to be leaning towards a bullish outlook, supported by resilient consumer spending and innovations in key sectors.
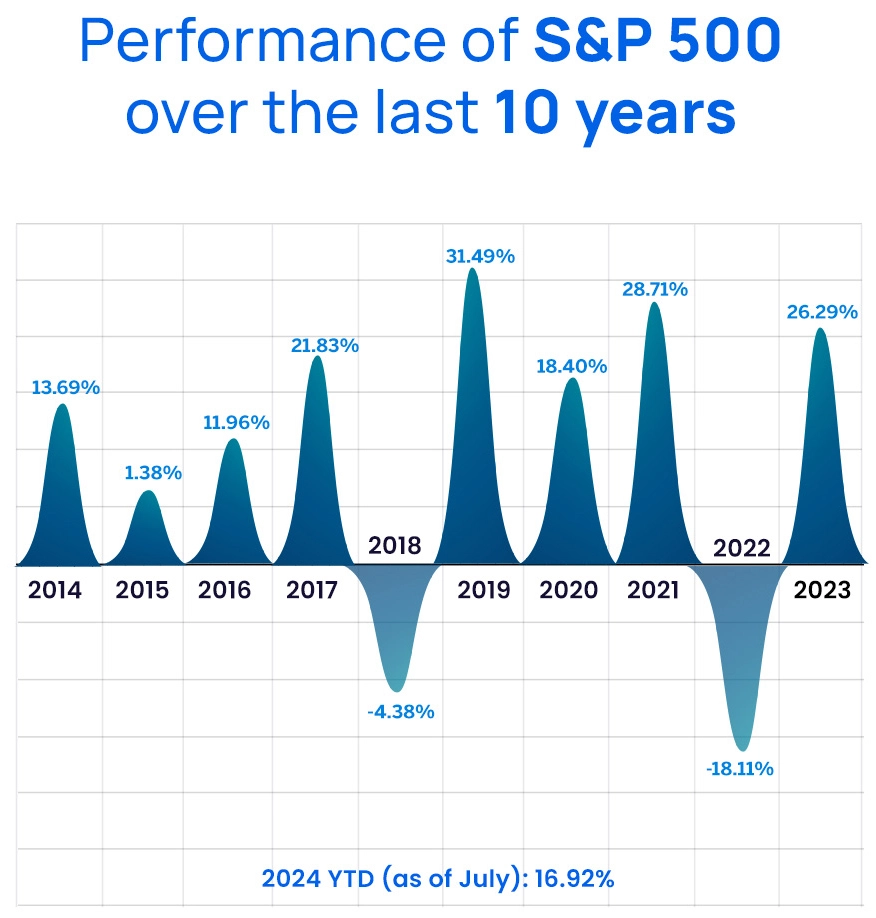
The S&P 500, which tracks the performance of 500 large-cap companies, has shown strong returns over the past decade.
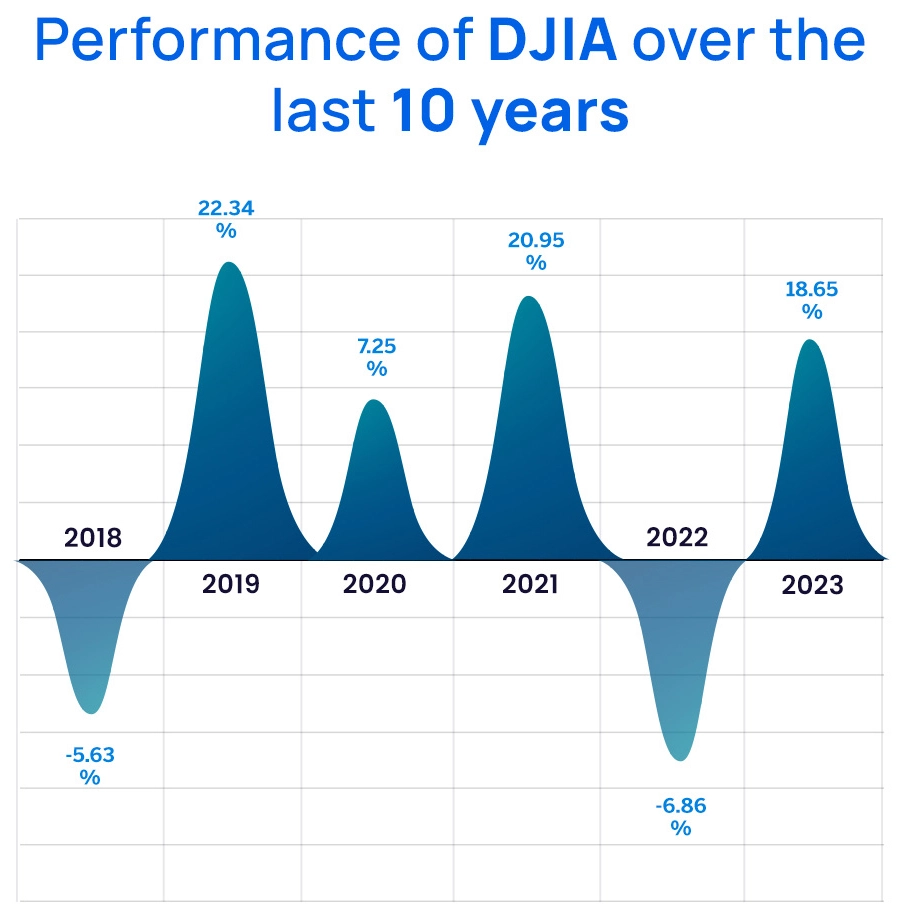
The Dow Jones Industrial Average (DJIA), which includes 30 large publicly-owned companies, has also performed well.
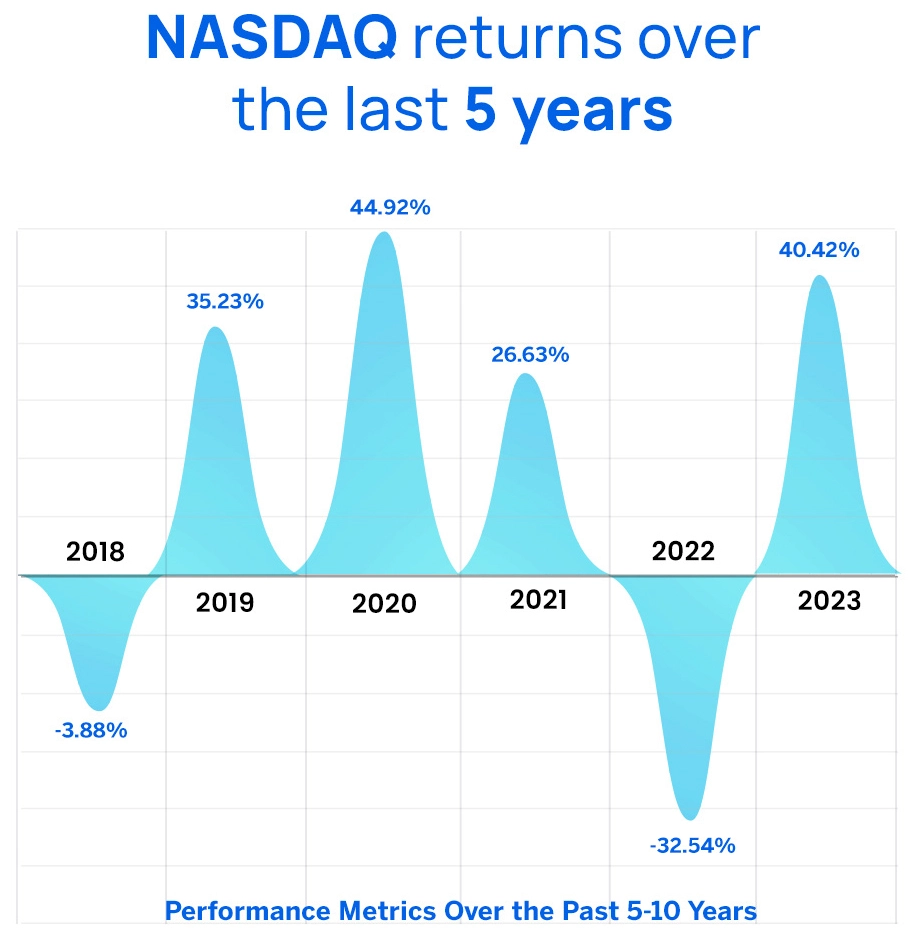
The NASDAQ, heavily weighted towards technology stocks, has seen impressive returns.
Over the past decade, the S&P 500 has delivered an average annual return of approximately 13.22%. The DJIA and NASDAQ have also shown strong performances, with the NASDAQ particularly benefiting from the tech boom.
Now, let’s get into the individual sectors and how they’re performing.
It comes as no surprise that technology is one of the top performers. The AI boom has certainly helped. But even apart from that, the chance to invest in the biggest tech companies in the world has always been one of the main attractions of the US markets.
Over the past decade, the technology sector, represented by the S&P North American Technology Sector Index, has seen significant growth. For instance, the sector’s market cap reached about $20 trillion. Continued innovation in AI and digital transformation is expected to drive further growth.
The healthcare sector has shown strong performance, benefiting from an ageing population and innovations in biotechnology and pharmaceuticals.
The healthcare sector’s average annual return has been around 10-12% over the past decade, with strong growth driven by pharmaceutical advancements and increased healthcare demand.
With ongoing medical advancements and an increasing focus on healthcare due to global health challenges, this sector is poised for continued growth.
The world is shifting towards sustainable and renewable energy. Fossil fuels are now being seen as increasingly disastrous for the environment, leading to rising investments in alternative forms of energy.
As a result, this sector is expanding and is slated for exponential growth.
Semiconductors are the fundamental building blocks present in all modern electronic devices. It is their presence that is enabling innovators to push the boundaries of technological discoveries, making avant-garde technologies like machine learning, AI and the Internet of Things (IoT) a reality. It is critical to note that the current internet-enabled economy will come to a screeching halt, if the supply from the semiconductor industry suffers a structural or global shock, as was seen during the pandemic affected years. Global consultancy firm McKinsey predicts that the semiconductor industry will morph into a trillion dollar industry by 2030.
Simply put, a data center is a facility where organizations use computing and storage resources to house their critical applications and data.
Often, data centers are owned or operated by large companies, mostly operational in the banking, telecom or cloud computing sector. These data centers are then leased out to other smaller companies, who bring in their own IT equipment. However, data centers are not limited only to the physical premises. They also include under its ambit virtual networks that provide cloud space to data and applications reserves housed across numerous physical data centers. One good example of the latter kind of data centers would be Amazon Web Services.
This sector is on a strong growth path. E-commerce giants like Amazon are eyeing massive capex spends of over $150 billion on data centers, given the heated anticipation building up in the AI space. The $150 billion fund allocation will serve as gunpowder for the company which is looking to ride the massive AI wave of the future.
According to McKinsey, global spending on construction of data centers is anticipated to reach $49 billion by 2030.
Here’s what you need to know about taxation and insurance before you actually start investing in the US stock markets.
With investments in Indian equities, it’s fairly straightforward. You have to pay long-term capital gains tax if you hold the investment for more than a year. And if you sell within a year of investment, you would have to pay short-term capital gains tax.
With US stocks, the scenario looks a little different. Let’s first take a look at what the applicable taxes are.

Now let’s get into the more interesting part — how can you optimise your tax planning?
Here are a few tax planning strategies that you can use:
The Dodd-Frank Wall Street Reform and Consumer Protection Act was enacted in response to the 2008 financial crisis. Its goal is to reduce risks in the financial system and improve accountability and transparency.
If you are in a situation where the brokerage firm with whom you invest runs into financial difficulties, in the US, you will be protected by the SIPC.
The Securities Investor Protection Corporation (SIPC) provides insurance for portfolios. The aim is to protect investors against the loss of cash and securities at financially troubled brokerage firms.
If you are ready to get started with the US market, let’s take a look at the most popular asset classes you can consider.
| Asset Class | Index | 2023 Returns |
|---|---|---|
| Equities | S&P 500 | 24% |
| Bonds | Bloomberg US Aggregate Bond Index | 1.86% |
| Mutual Funds & ETFs | Vanguard Total Stock Market Index Fund | 25.89% |
| Real Estate | The FTSE Nareit All REITs Index | 11.48% |
| Alternative Investment | HFRI Fund Weighted Composite Index | 7.5% |
| Sector | ETFs | 2023 Returns |
|---|---|---|
| Technology | Nasdaq 100 Technology Sector Index | 67.81% |
| Real Estate | Vanguard Real Estate Index Fund | 11.79% |
| Semiconductors | VanEck Semiconductors | 73.37% |
| Gold | ProShares Ultra Gold | 15.56% |
| Crypto Currencies | First Trust SkyBridge Crypto Industry and Digital Economy |
193.86% |
| Financials | ProShares Ultra Financial | 22.17% |
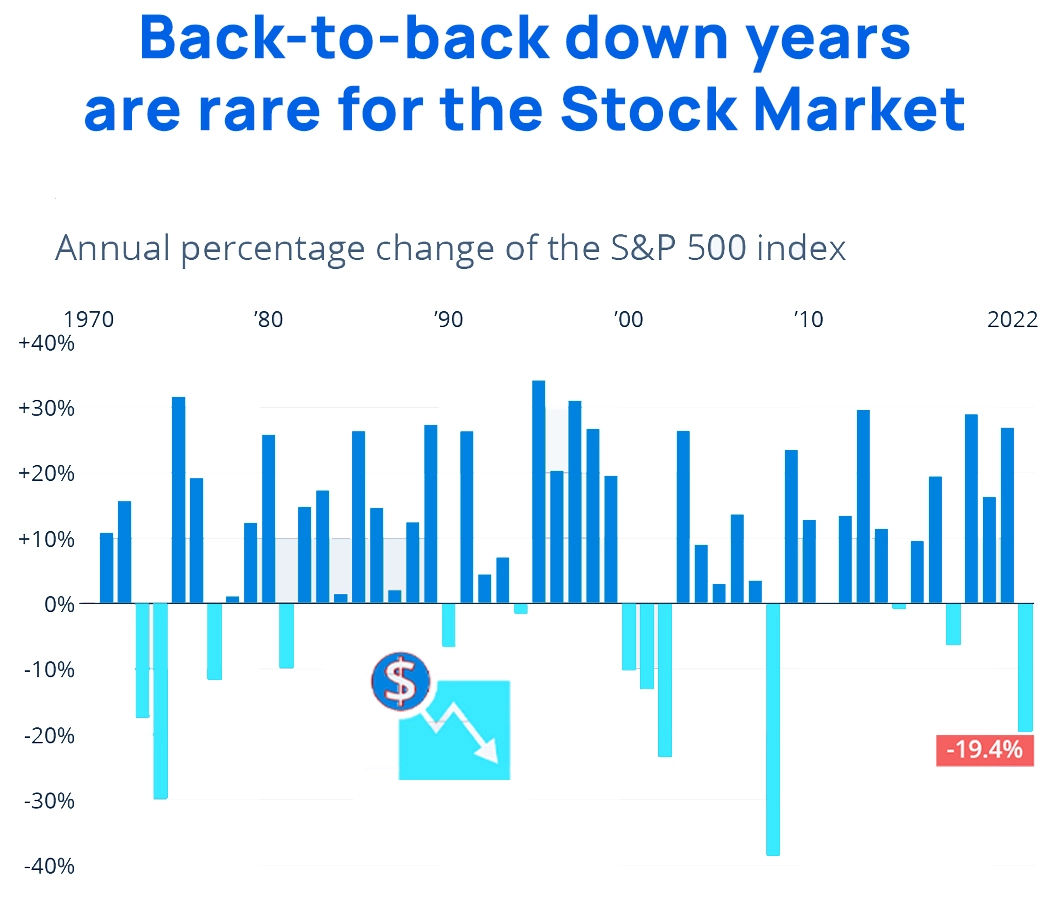
In 2024, the S&P 500 returned about 16.48% YTD.
| Year | Return (%) |
|---|---|
| 2014 | 11.39 |
| 2015 | -0.73 |
| 2016 | 9.54 |
| 2017 | 19.42 |
| 2018 | -6.24 |
| 2019 | 28.88 |
| 2020 | 16.26 |
| 2021 | 26.89 |
| 2022 | -19.44 |
| 2023 | 24.23 |
| Company & Ticker | Performance in 2024 |
|---|---|
| Super Microcomputer (SMCI) | 188.2% |
| Nvidia (NVDA) | 149.5% |
| Vistra (VST) | 123.2% |
| Constellation Energy (CEG) | 71.3% |
| General Electric (GE) | 55.9% |
| Eli Lilly (LLY) | 55.3% |
| Micron (MU) | 54.1% |
| NRG Energy (NRG) | 50.6% |
| Crowdstrike (CRWD) | 50.1% |
| Arista Networks (ANET) | 48.8% |
According to data from CEIC,
The question is — why?
It is certainly not one of the fastest-growing economies. Far from it, in fact. The
US economy, as it is already quite far along the development trajectory, records a growth rate that is much lower than what emerging economies witness.
Yet, the numbers don’t lie. More and more global investors are pouring their surplus funds into the US capital markets.
The key reason is the stability, strength and prospect of the market. It is the infallible belief that no matter what happens, the US economy will continue to thrive.
There are two main ways you can get started.
The first option is that you open a trading account directly with a US brokerage firm. You can choose from any of the online platforms.
The second option is to open an account with an Indian platform that offers you access to US equities.
Both come with their own set of pros and cons. Let’s take a look:
Once you’ve made your choice of the platform, here are the key requirements for opening an account:
Full disclaimer, UPI will not work here. So stow your QR scanner away.
There are two main methods that you can use to transfer funds — wire transfer or remittance services.
If you opt for the wire transfer route, you’ll have to initiate the process from your bank account, and send the funds directly to your brokerage account.
Here’s what you need to know about the wire transfer method:
The other option is that you use a remittance service like SWIFT or Western Union to transfer the funds into your brokerage account.
Transferring ₹10,00,000 (Approx. $12,048) to a US Brokerage:
First, of course, is the benefit of diversification. This is Investing 101.
We’re not saying you only have to invest in US equities but look at multiple asset classes and sectors. It makes sense to track and add some of the largest, most innovative and stable companies globally like Apple, Google and Microsoft.
The objective is to expand the reach of your portfolio so that you can reduce risk exposure.
As an added bonus, the US market also offers access to a wide range of sectors like AI and green energy, which may not be as developed or accessible in India.
Historically, the sync between the US and Indian stock markets was stronger with correlation coefficients between 0.6 to 0.7. However, in recent years, this has dipped to between 0.4 and 0.5.
This makes it ideal for diversification.
Many US companies have a strong track record of consistent growth and profitability. For instance, tech giants like Apple and Amazon have grown steadily and delivered substantial returns over the years.
The US is home to Silicon Valley, a hub for technological innovation and startups. You get access to the best of the best, in short.
It is a well known fact that the US dollar has been becoming expensive against the rupee.
Well, investing in US stocks can actually allow you to benefit from this!
If you’ve invested in US equities, you can enhance your prospective returns when you’re selling and withdrawing your investments back in INR.
Plus, holding assets in USD can also act as a hedge against the depreciation of the Indian rupee, and in turn, protect the value of your portfolio.
This is something unheard of with Indian stocks.
With US equities, you can buy shares in fractions at INR 1, just like mutual fund units. You don’t have to stick to whole numbers, and this can allow you to invest in the biggest companies with very small amounts of money.
This comes with the fact that the US economy is already well-developed. This means the growth rate is lower, and therefore, so is the volatility.
With the Indian markets, we often observe large-scale fluctuations on either side. In comparison, the US market is more stable and can, therefore, provide a more predictable investment environment.
The future, as we say, is just getting started.
More and more young and old Indian retail investors will start to venture out and look for opportunities beyond the geographical bounds of Dalal Street. The US is going to be one of the top destinations.
If you’re still unsure about how you’re going to go about it, we at Appreciate have got your back. With Appreciate, you can now create wealth with US investments in a single click, at the lowest cost.


By joining our referral program, you agree to our Terms of Use
Powered by Viral Loops.

Invest as little as Re.1 in US Stocks