The dynamics of the stock market can seem mysterious but tools like the market mood index offer valuable insights into investor sentiments. In the Indian context, the market often moves based on a mix of corporate earnings, global cues and the collective emotions of millions of participants. This blog explores what the Market Mood Index is, its significance in the Indian share market and how investors use it to make informed decisions.
By quantifying emotions like fear and greed, the market mood indicator helps you look past the daily noise of price fluctuations. Understanding this index is not about predicting the exact top or bottom of the market. Instead, it is about identifying the overall climate—whether the crowd is currently over-optimistic or irrationally fearful—so you can align your strategy accordingly.
Key Takeaway
- The market mood index is a sentiment-tracking tool for the Nifty 50 on a scale of 0 to 100.
- High scores above 70 indicate “Extreme Greed,” while scores below 30 reflect “Extreme Fear.”
- It combines factors like FII net open interest, volatility and skew (India VIX), market momentum, market breadth, price strength, and demand for gold.
- Investors use it as a contrarian indicator to avoid buying at peaks.
What is Market Mood Index?
The market mood index India is a sentiment-tracking tool designed to gauge the prevailing emotional state of the Indian stock market, specifically focusing on the Nifty 50 index. It operates on a numerical scale from 0 to 100. A low score suggests that the market is gripped by fear, while a high score indicates that greed is driving the price action. The primary purpose is to help investors identify whether the market is overbought or oversold based on investor psychology rather than just financial ratios.
Such an index becomes important because, in the short run, the price of assets can be influenced more by human sentiments rather than the actual value of the underlying asset. In case of fear, investors tend to sell good-quality stocks below their real price. On the other hand, in the state of greed, investors may take prices to unsustainable levels. This way, through the use of this MMI, you can visualize sentiments on the street.
The origins of the market mood index in India are linked to the need for a localised version of global sentiment gauges, such as the CNN Fear & Greed Index used in the US. Financial platforms in India, most notably Tickertape, developed this tool to suit the unique characteristics of the National Stock Exchange (NSE) and Bombay Stock Exchange (BSE). It was built to account for local variables like the activity of Foreign Institutional Investors (FIIs) and domestic volatility.
Components of Market Mood Index
The market mood index today is not a random number; it is calculated by giving equal weight to each of the six components. The combined score is then normalised to produce a value between 0 and 100. These components work together to provide a comprehensive view of market psychology.
How Market Mood Index is Calculated
- FII Activity: This measures the net open interest of Foreign Institutional Investors in index futures. Since FIIs are major drivers of liquidity in India, their positioning is a heavyweight in the index.
- Volatility and Skew: This involves the India VIX, often called the “fear gauge.” A rising VIX indicates increasing uncertainty and fear among traders.
- Market Momentum: This is calculated as the difference between the 30-day and 90-day EMAs of Nifty 50, divided by the 90-day EMA. A positive value signals upward momentum (greed), while a negative value signals downward momentum (fear).
- Market Breadth: This uses the Modified Arms Index to compare the ratio of advancing stocks to declining stocks. A rally backed by many stocks is considered healthier than one led by just a few.
- Price Strength: This looks at the net percentage of stocks trading near their 52-week highs versus those near their 52-week lows.
- Demand for Gold: Gold is a safe-haven asset. When investors are scared of stocks, they buy gold. The MMI tracks the relative price return of gold compared to the Nifty 50.
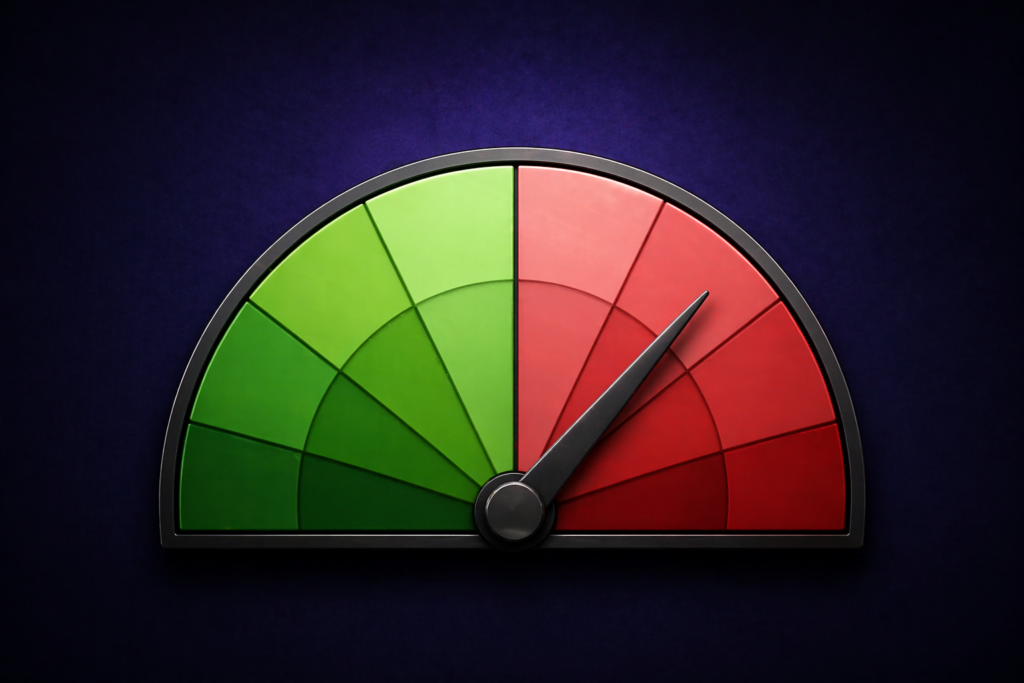
The Four Mood Zones
The market mood indicator categorises the market into four specific emotional zones. Many platforms report the market in a specific zone based on recent closing data.
| Score Range | Zone | Market Sentiment | Investor Behavior |
| Below 30 | Extreme Fear | High Panic | People are selling everything; the market is likely oversold. |
| 30 to 50 | Fear | Cautious | Investors are nervous and waiting for more clarity. |
| 50 to 70 | Greed | Optimistic | Confidence is high; prices are rising steadily. |
| Above 70 | Extreme Greed | Euphoric | Irrational buying; the market is likely overbought and due for a dip. |
Significance of Market Mood Index in the Indian Stock Market
The market mood index in India is significant because it acts as a reality check for retail investors. In the Indian market, retail participation has surged over the last few years. New investors often get caught up in “Fear of Missing Out” (FOMO) when the market is at an all-time high. The MMI provides a data-backed reason to pause and evaluate if the current rally is driven by fundamentals or pure greed.
It also affects market predictions by highlighting potential reversal points. Historically, when the MMI enters the “Extreme Greed” zone, the probability of a market correction increases. While it cannot predict the exact day a crash will happen, it alerts you that the risk-to-reward ratio is no longer favourable for fresh aggressive buying.
Traders rely on this index for strategy alignment. For instance, a swing trader might look at the market mood index today to decide whether to book profits. If the index is at 80 (Extreme Greed), the trader might decide to tighten their stop losses or reduce position sizes. Conversely, long-term investors might wait for the “Extreme Fear” zone to deploy their idle cash, as this is when “quality” stocks often trade at reasonable valuations.
How Investors Use Market Mood Index
Investors integrate market mood index insights into various strategies depending on their time horizon and risk appetite.
- Short-term Trading Strategies
Traders often use the MMI as a contrarian tool. The logic is simple: when everyone else is greedy, be fearful and when everyone else is fearful, be greedy. If the MMI shows “Extreme Fear,” a short-term trader might look for signs of a technical bounce on the Nifty 50 charts to enter a “long” position. On the flip side, if the index is in “Extreme Greed,” they might avoid taking fresh long trades to prevent getting caught in a sudden sell-off.
- Long-term Investing Implications
For long-term investors, the MMI is less about daily trading and more about capital allocation. Instead of trying to “time” the market perfectly, these investors use the MMI to decide the pace of their investments. If the market is in the “Greed” zone, they might stick to their regular Systematic Investment Plans (SIPs). If the market enters “Extreme Fear,” they might consider making a lump-sum investment to take advantage of lower prices.
- Where to Access Data
You can find market mood index values today on several Indian financial platforms. Tickertape is the most popular source for this specific index. Other major brokers like Angel One and various financial news websites like Goodreturns also provide live or daily updates of the sentiment score. These values are updated based on the previous day’s market close or near-real-time data during trading hours.
Advantages and Limitations of Market Mood Index
The primary advantage of the market mood indicator is that it removes subjectivity from sentiment analysis. Instead of relying on “gut feeling” or “news headlines,” you have a mathematical score derived from actual market data like the India VIX and FII flows. It encourages disciplined investing by providing clear signals on when the crowd is becoming irrational.
However, there are limitations that you must keep in mind. The MMI is a sentiment tool, not a fundamental one. It does not tell you if a specific company is profitable or if its management is competent. A stock can be “cheap” fundamentally even when the overall market mood is “Greedy.” Similarly, the index reflects the mood of the large-cap Nifty 50; it may not accurately represent the mood in small-cap or mid-cap stocks, which can sometimes move independently.
Another limitation is that sentiment can remain in a “Greed” zone for a long time during a bull market. If an investor sells everything as soon as the index hits 70, they might miss out on a significant portion of a rally. Therefore, it is best used as a “caution light” rather than a definitive “stop” signal. It should always be used in conjunction with other technical and fundamental analysis tools.
Conclusion
The market mood index serves as a vital compass for navigating the often-emotional landscape of the Indian share market. Measuring the overall psychological mood of the market can provide a realistic view that can protect you from falling into the trap of emotional trading. No matter if you are a day trader searching for an opportunity or an investor making his future plans, this index can provide the necessary background to explain the reasons behind the movements on the market.
Ultimately, successful investing in India requires a balance of data, patience and self-awareness. While the market mood index India helps you understand what the crowd is doing, your individual goals should always drive your final decisions.
FAQs on Market Mood Index
The market mood index is a sentiment indicator that measures the emotional state of the Indian stock market. It uses a scale from 0 to 100 to show whether the prevailing mood is one of fear or greed based on various market data points.
A high score on the MMI can indicate an overbought market, causing a trader to take profits and stop buying, while a low score may indicate that it is time for a buy because of panic in the market.
Investors can find reliable market mood index data today on platforms like Tickertape, which developed the index.
Although not “necessary” from an official standpoint, it is very valuable for anyone who wants to make their decision based on reason rather than emotion. It is particularly valuable for newbies, who could be easily swayed by hype or panic.
The MMI does not account for the fundamental health of individual companies or sectors. It is a broad market gauge and can sometimes stay in a “Greed” or “Fear” zone longer than expected, making it a poor tool for precise market timing. Always consult a professional before making major investment changes.
Disclaimer: Investments in securities markets are subject to market risks. Read all related documents carefully before investing. The securities and examples mentioned above are only for illustration and are not recommendations.