In trading, price moves tell only half the story—the Relative Strength Index (RSI) reveals the other half by showing the strength behind those moves. It’s a momentum oscillator that compares a stock’s recent gains to its recent losses, plotting the result on a scale from 0 to 100.
Continue reading as we highlight its importance in understanding stock price momentum and market conditions.
What is RSI?
The Relative Strength Index (RSI) measures the speed and magnitude of recent price changes to assess whether a stock or asset is overbought or oversold. Developed by J. Welles Wilder in 1978, RSI is now one of the most widely used technical indicators in trading.
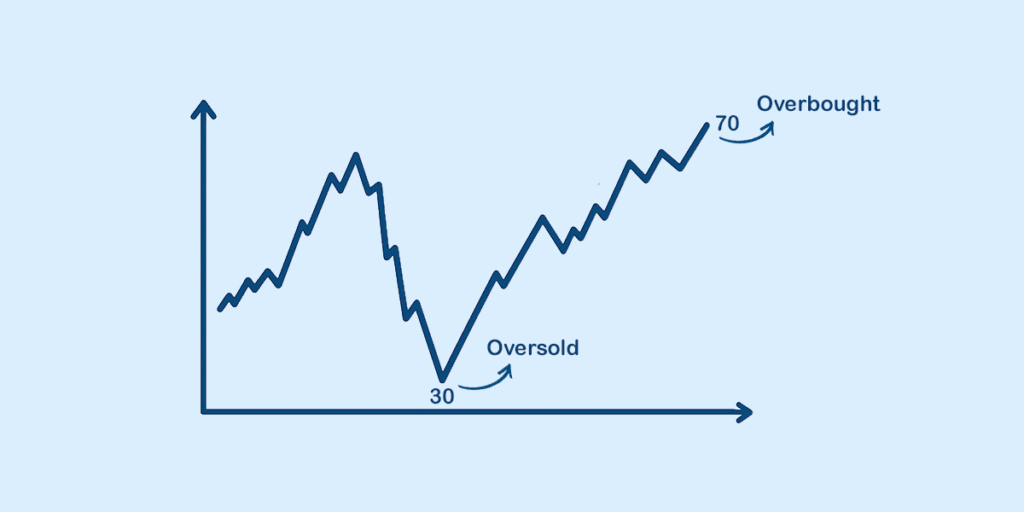
It is commonly calculated over 14 periods—which could be days, hours, or minutes, depending on the chart timeframe. Additionally, traders use RSI to spot potential market turning points by assessing overbought—above 70—or oversold—below 30—conditions.
How is RSI Calculated?
You can calculate RSI using the following formula:
RSI = 100 – [100 / (1 + RS)]
Where RS = Average Gain / Average Loss
RSI Thresholds:
- RSI > 70: Overbought (possible price pullback)
- RSI < 30: Oversold (possible price rebound)
RSI uses smoothed moving averages of gains and losses to avoid reacting to minor, short-lived price fluctuations. This smoothing helps filter out noise and makes the indicator more reliable for identifying true momentum shifts.
How to Use the RSI Indicator in Trading?
The Relative Strength Index lets you measure momentum and identify overbought or oversold conditions. If you use it correctly, it can help you identify potential entry/exit points, confirm trends, and filter false moves.
For global investors, especially those exploring how to invest in US stocks from India, RSI becomes a useful tool to time entries in highly liquid markets like US equities.
Here is a step-by-step guide to using RSI in trading:
- Understand the RSI Scale: RSI values range from 0 to 100. Above 70 often indicates an overbought condition (potential for price correction). Below 30 often indicates an oversold condition (potential for price rebound).
- Identify Overbought & Oversold Zones: Use these levels to spot potential reversals. For example, if RSI is above 70 and starts to turn down, it may be a good time to consider profit booking.
- Confirm with Price Action: Combine RSI signals with candlestick patterns or support/resistance levels. A bullish reversal pattern near oversold RSI levels increases trade reliability.
- Spot Divergences:
- Bullish Divergence: Price makes a lower low whereas RSI makes a higher low, possible upward reversal.
- Bearish Divergence: Price makes a higher high whereas RSI makes a lower high, possible downward reversal.
- Adjust RSI Settings for Timeframe: Standard setting is 14 periods, but shorter settings (e.g., 7 or 9) make RSI more sensitive for intraday trading. Whereas, longer settings (e.g., 21) smoothen signals for positional or swing trading.
- Combine with Other Indicators: Use alongside trend indicators (like MACD) or volatility tools (like Bollinger Bands) to filter false signals.
RSI vs Other Technical Indicators
The RSI is one of the most widely used momentum oscillators, but it’s rarely used in isolation. Traders often compare it with other popular tools—MACD, Bollinger Bands, and the Stochastic Oscillator—to get a more complete picture of market trends.
Each indicator has its strengths, and knowing when RSI performs better and when to pair it with others can improve decision-making:
| Indicator | Type | Key Use | Strengths |
| RSI (Relative Strength Index) | Momentum Oscillator | Identifies overbought/oversold levels | Simple to interpret, works well in trending markets |
| MACD (Moving Average Convergence Divergence) | Trend-Following Momentum | Shows trend direction and strength | Captures longer-term momentum, good for trend confirmation |
| Bollinger Bands | Volatility Indicator | Measures price volatility around a moving average | Highlights price extremes and volatility squeezes |
| Stochastic Oscillator | Momentum Oscillator | Compares the closing price to the price range over a period | Sensitive to price changes, good for short-term setups |
When to rely more on RSI:
- In strong trending markets, it is important to spot potential pullbacks or reversals.
- When you need a quick read on momentum without complex settings.
Why traders use RSI alongside other indicators:
- To filter out false signals and boost accuracy.
- To combine momentum insights (RSI) with trend direction (MACD) or volatility cues (Bollinger Bands).
Limitations of the RSI Indicator
While the RSI have several benefits, traders need to understand its limitations, which will help them avoid costly mistakes:
- False signals in sideways or choppy markets: The RSI indicator, in a range-bound market, can oscillate frequently between overbought and oversold zones without a clear price trend, leading to premature entries or exits.
- Lagging nature due to past price dependence: RSI is calculated using historical price data, which means it reacts after the movement has already occurred, potentially delaying signals in fast-moving markets.
- Need for confirmation from other tools: Volume trends, candlestick patterns, or moving averages should be used alongside RSI to validate signals and reduce the risk of false setups.
- Risk of using RSI in isolation: Relying solely on RSI without considering broader market conditions or multiple indicators can result in trades that align with momentum but go against the overall trend.
FAQs
What does RSI mean in stock trading?
RSI meaning in stock trading, refers to the Relative Strength Index, a momentum oscillator used to measure the speed and difference in price movements. The RSI indicator ranges between 0 and 100 and helps traders identify if a stock is overbought or oversold, making it a popular tool in technical analysis.
What is a good RSI value to buy a stock?
A good RSI value to buy a stock is typically below 30, as it may indicate that the stock is oversold and could be due for a price rebound. However, you need to pair RSI with support/resistance analysis and market trends for better accuracy.
What is the ideal RSI setting?
The ideal RSI setting for most traders is a 14-period calculation, which is the default in most charting platforms. This setting balances sensitivity and reliability, making it suitable for various timeframes. Short-term traders may use a 7-period RSI for faster signals, while long-term investors may prefer a 21-period RSI for smoother trends.
Is RSI good for intraday trading?
Yes, RSI is good for intraday trading because it helps identify quick overbought and oversold conditions within smaller timeframes, such as 5-minute or 15-minute charts. Intraday traders often combine the RSI indicator with volume and price action to confirm trade entries and exits.
What is the difference between RSI and MACD?
The difference between RSI and MACD lies in their calculation and purpose. RSI (Relative Strength Index) measures momentum and overbought/oversold conditions, while MACD tracks the relationship between two moving averages to recognise trend direction and strength. Many traders use RSI and MACD together for more reliable trade signals.
Disclaimer
The information provided in this article is for educational and informational purposes only. It should not be considered as financial or investment advice. Investing in stocks involves risk, and it is important to conduct your research and consult with a qualified financial advisor before making any investment decisions. The author and publisher are not responsible for any financial losses or gains that may result from the use of this information.