
Every price change you see in the stock market — however tiny — is a tick. Whether you are watching a Nifty 50 futures contract nudge ₹0.05 higher or an E-mini S&P 500 future shift by 0.25 index points, that movement is one tick. Understanding what a tick is, how tick size varies across markets, and how to use tick charts to interpret real-time market activity is foundational knowledge for any serious trader.
This guide covers everything: the definition of a tick, tick size and tick value, tick direction, tick data, tick chart mechanics, and practical strategies for using ticks in your trading.
Quick Summary
The stock market has a lot of concepts and is full of jargon. One such concept in financial markets is tick trading and tick sizes. A “tick” is defined as the smallest possible price movement an asset can make, and understanding it is crucial for making informed trading decisions. The article covers how tick sizes function, and their psychological impact on traders. It teaches you how to read and utilize tick charts to identify price movements and trends. If you can read “ticks” you can get better at customizing trading strategies and detecting market noise. Furthermore, the article differentiates between tick size and tick value, and offers advice on effectively managing tick size to optimize your trading performance.
What are Ticks in Trading?
A tick is the minimum increment by which the price of a financial instrument — a stock, futures contract, currency pair, or option — can change in a single trade. If a stock is priced at ₹500.00 and the tick size is ₹0.05, the next valid price is either ₹500.05 or ₹499.95. No price between those two is permitted.
Three attributes define every tick:
- Tick Size: The fixed minimum price increment, set by the exchange or regulator.
- Tick Value: The monetary gain or loss that one tick movement represents, calculated as tick size × contract/lot size.
- Tick Direction: Whether the tick is an uptick (price rose), a downtick (price fell), or a zero tick (price unchanged vs the previous trade).
What Is Tick Direction? Uptick, Downtick & Zero Tick
Tick direction tells you the short-term momentum behind each price movement:
- Uptick: The price moved up by one tick vs the previous trade — signals buying pressure.
- Downtick: The price moved down by one tick — signals selling pressure.
- Zero Tick: The price is the same as the previous trade — neutral; no fresh direction signal.
A succession of upticks suggests aggressive buyers are in control. A stream of downticks indicates sellers are dominant. Tick direction is a key input for scalpers making split-second entry and exit decisions.
What Is Tick Data? How Tick-by-Tick Data Is Used
Tick data is a complete, trade-by-trade record of every price change in the market, including the exact price, volume, and timestamp of each individual transaction. Unlike time-based data (which groups all trades in a given period into one candle), tick data is granular — it shows you every single tick.
Tick-by-tick trading (also called tick tick trading) uses this data to identify micro-patterns and execute trades at the fastest possible pace. It is the data backbone of:
- Scalping strategies targeting tiny, rapid price moves
- High-frequency trading (HFT) algorithms
- Order flow analysis and volume profiling
- Backtesting ultra-short timeframe strategies
For Indian retail traders, tick data is available through NSE data feeds and third-party platforms like Zerodha’s Kite, TradingView, and Amibroker.
Historical Context of Tick Size
Originally, financial markets used fractions to express tick sizes. For example, in the U.S. stock market, prices moved in fractions like 1/16th of a dollar, meaning the smallest price movement was $0.0625.
But in 2001, the SEC implemented decimalization, requiring stocks to be priced in decimals instead of fractions. This change aimed to make prices easier to understand and trading more efficient by reducing the minimum tick size to one cent ($0.01), making trading more precise. This shift allowed for tighter bid-ask spreads, making trading cheaper and improving market liquidity.
For Indian investors learning how to invest in US stocks from India, this change is important because US markets operate with high precision pricing, which directly affects order execution and cost efficiency.
Other countries and markets have also made similar changes. For example, in India, the Securities and Exchange Board of India (SEBI) regulates tick sizes based on market capitalization. This approach helps balance market stability and trading efficiency.
How a Tick Works
A tick represents the smallest price movement that a security can make in the market. For example, if a stock is priced at $50.00 and the tick size is $0.01, the next possible price it can trade at could be $50.01 or $49.99. Tick sizes are different across instruments as well. For instance, in the futures market, the E-mini S&P 500 futures contract has a tick size of $0.25. Similarly, in the commodities market, gold futures have a tick size of $0.10.
The tick size affects market liquidity and volatility. Smaller tick sizes can lead to tighter bid-ask spreads, whereas a larger tick size can increase your trading costs but reduce market noise by making price movements clearer.
Tick size is not universal — it varies significantly by asset class, exchange, and the price level of the instrument. Here is a consolidated reference:
|
Market / Instrument |
Exchange |
Tick Size |
Tick Value (Approx.) |
Regulator |
|
US Large-Cap Stocks (>$1) |
NYSE / NASDAQ |
$0.01 |
$0.01 per share |
SEC |
|
US Penny Stocks (<$1) |
NYSE / NASDAQ |
$0.0001 |
$0.0001 per share |
SEC |
|
E-mini S&P 500 Futures |
CME |
0.25 index points |
$12.50 per contract |
CFTC |
|
COMEX Gold Futures (std) |
COMEX |
$0.10/troy oz |
$10 per contract |
CFTC |
|
WTI Crude Oil Futures |
NYMEX |
$0.01/barrel |
$10 per contract |
CFTC |
|
NSE Large-Cap Stocks (India) |
NSE |
₹0.05 |
₹0.05 per share |
SEBI |
|
Nifty 50 Futures (India) |
NSE |
₹0.05 |
₹2.50 per lot (50 units) |
SEBI |
|
Nifty Options >₹3 (India) |
NSE |
₹0.05 |
Varies by lot size |
SEBI |
Psychological Impact of Tick Size on Traders
Tick size not only affects the mechanics of trading but can also impact you psychologically. The size of a tick can influence your behaviour and decision-making process in several ways.
Confidence in Quick Decisions
Smaller tick sizes can make you feel more confident in making quick decisions because the price movements are less intimidating. This can be beneficial in fast-moving markets, allowing you to capitalise on brief opportunities.
Overtrading Temptation
However, smaller tick sizes can lead to overtrading, as frequent small movements might trick you into thinking each change is significant. This behaviour can significantly increase your transaction costs and potentially lead to losses, as each trade incurs fees.
Stability with Larger Tick Sizes
On the other hand, larger tick sizes can provide a sense of stability by making market trends clearer and easier to follow. This can reduce the temptation to overtrade and help you focus on more significant market movements.
Perception of Risk
Additionally, tick size can affect your perception of risk. Smaller tick sizes might make the market seem more volatile because prices appear to change constantly. On the other hand, larger tick sizes can make the market seem calmer and less risky.
Understanding the psychological impact of tick size helps you develop better trading habits. If you are self aware enough to know how tick sizes can influence your emotions, you can avoid the bad trading habits that it can cause.
How do Tick Charts Work?
Tick charts are a powerful tool in trading, especially when you want to get a clear picture of market activity. Unlike traditional time-based charts, tick charts are based on the number of trades that occur. This means each bar or candlestick on a tick chart is created after a specific number of transactions.
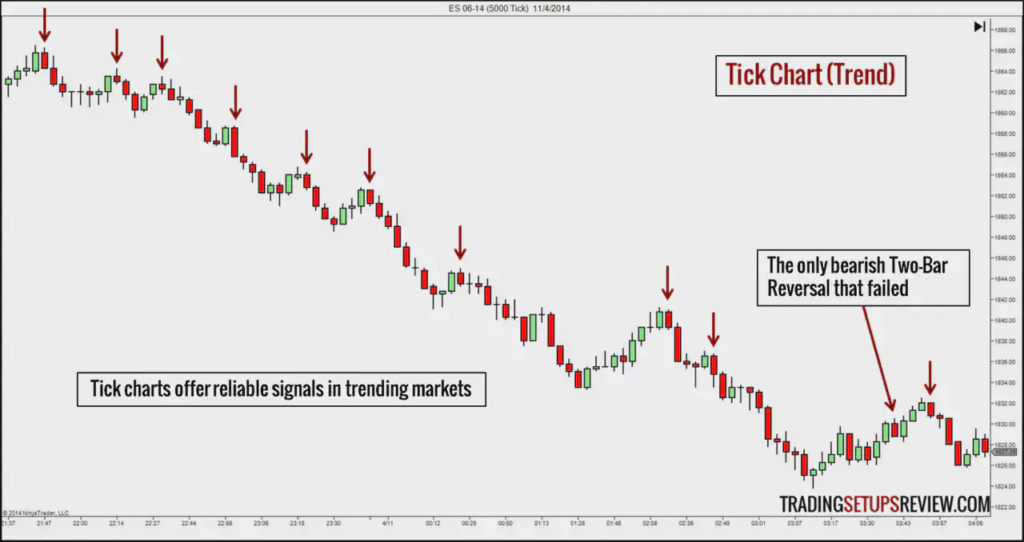
Tick charts are constructed by plotting a new bar or candlestick after a certain number of trades have been completed. For example, in a 1000-tick chart, a new bar is created every 1000 trades. This provides a more detailed view of market activity, especially during periods of high trading volume.
Using tick charts can help you identify significant price movements and trends. For instance, during a trading session with high activity, a tick chart will generate more bars, giving you more granular data on price changes. This can be particularly useful for day traders who need to make quick decisions based on the latest market information.
Tick Charts vs Time-Based Charts
One of the main differences between tick charts and time-based charts is how they respond to periods of high and low trading activity. On a time-based chart, each bar represents a set period, regardless of how many trades occurred.
A tick chart, on the other hand, creates bars based on trade volume, providing a more accurate and reliable view of the actual levels of activity and participation in the market. This can help you better understand market dynamics, and you can use that to your advantage.
Benefits of Using Tick Charts
Tick charts offer several benefits that can enhance your trading strategy. They can help you identify when smart money is stepping in, smooth out price movements during pre-market and after-hours trading, and reduce noise in the data. By focusing on trade timing, tick charts can provide a clearer picture of market trends and help you make more accurate predictions about future price movements.
How to Read Tick Charts
Reading a tick chart can provide valuable insights into market activity, helping you make informed trading decisions. Here’s a step-by-step guide on how to interpret tick charts effectively.
Price Range
The height of each candlestick or bar on a tick chart represents the price range of trades during the tick interval. By examining the height, you can gauge the intensity of price swings. Tall bars indicate high volatility, while shorter bars suggest more stable price movements.
Tick Value Flexibility
Tick charts are highly flexible and can be customised to fit different trading strategies. You can adjust the tick value based on market conditions. For volatile markets, you might use a smaller tick value to capture more granular price movements. In quieter markets, a larger tick value might help you focus on significant trends without getting distracted by minor fluctuations. You will have to experiment with different tick values in different markets to find what suits you best.
Candle Representation
Each candle on a tick chart represents a specific number of trades, not a specific time period. During high trading volume, candles will form more quickly, providing detailed insights into rapid price changes. Conversely, during low volume periods, candles will form more slowly, giving you a clearer view of the overall market trend.
Pattern Trends
Tick charts can help you identify important patterns and trends. For example, you might spot breakout patterns where the price moves sharply above or below a resistance or support level. Reversal patterns, such as head and shoulders or double tops, can also be easier to identify on tick charts.
Advantages of Trading with Tick Charts
Using tick charts in your trading strategy offers several advantages that can help you gain a competitive edge in the market.
Customised Trading Strategies
Tick charts allow you to customise your trading approach based on the number of transactions rather than time. This flexibility lets you better adapt to different market conditions.
Detecting Market Noise
Tick charts are excellent at filtering out market noise, which can obscure meaningful price movements on traditional time-based charts. By focusing on trade volume, tick charts highlight true market activity and trends.
Real-Time Action Insights
Tick charts provide real-time insights into market action by updating with every completed trade. This continuous flow of information allows you to react quickly to market changes.
More Precise Entry and Exit Points
By providing a more granular view of price movements, tick charts can help you pinpoint precise entry and exit points for your trades. This is particularly valuable in fast-moving markets where timing is crucial.
Understanding Market Sentiment
Tick charts can also give you a better understanding of market sentiment. By observing the volume of trades and the speed at which tick bars form, you can gauge the level of interest and activity in the market.
Tick Size in Stock Trading
In stock trading, tick size refers to the smallest price increment by which a stock’s price can move. In India, SEBI regulates tick sizes. Stocks with a market capitalization above ₹10,000 crores have a tick size of ₹0.01, while those with a market capitalization between ₹3000 crores and ₹10,000 crores have a tick size of ₹0.05. In the USA, the SEC regulates tick sizes. Since 2001, the minimum tick size for stocks trading above $1 is one cent ($0.01).
Tick Size in Futures Trading
In futures trading, tick size is the smallest price fluctuation that a futures contract can make. In India, the Nifty 50 futures contract has a tick size of ₹0.05. In the USA, the E-mini S&P 500 futures contract has a tick size of $0.25. Different futures contracts have varying tick sizes based on their specifications.
Tick Size in Options Trading
Tick size in options trading is the smallest price increment by which an option’s price can move. In India, options on indices like Nifty 50 and stocks have tick sizes regulated by SEBI. Options priced above ₹3 typically have a tick size of ₹0.10, while those priced below ₹3 might have a tick size of ₹0.05. In the USA, options have tick sizes that can vary based on the underlying security.
How to Manage Tick Size Effectively
Effectively managing tick size is crucial for optimising your trading strategies and improving overall performance. Here are some key aspects to consider when managing tick size in your trades.
Adapting to Market Conditions
In highly volatile markets, using smaller tick sizes can help you capture more detailed price movements and react swiftly to changes. Conversely, in more stable markets, larger tick sizes can help you focus on significant trends without getting distracted by minor fluctuations.
Balancing Precision and Cost
Smaller tick sizes can lead to more precise pricing and tighter bid-ask spreads, reducing your trading costs. However, they can also increase the frequency of trades, potentially leading to higher transaction costs. It’s essential to strike a balance between precision and cost.
Leverage Technology for Automated Trading
Modern trading platforms offer advanced tools and features that can help you manage tick sizes more effectively. Use these tools to set custom tick sizes, monitor market conditions, and execute trades with greater precision. Automated trading systems can also help you optimise tick size management by executing trades based on predefined criteria. This can help you become more consistent in your trading.
Tick Size vs Tick Value
The primary difference between tick size and tick value lies in their application. Tick size is a static measure set by regulatory authorities to standardise price movements, whereas tick value is a dynamic measure that depends on the specific trade and contract specifications.
Tick size refers to the smallest price increment by which a security’s price can move. It is a fixed value determined by regulatory bodies or exchanges. For example, In the USA, the SEC mandates that the minimum tick size for stocks trading above $1 is one cent ($0.01).
Tick value, on the other hand, represents the monetary value of a single tick movement. It varies based on the size of the tick and the number of shares or contracts involved in a trade. For instance, in futures trading, the tick value is calculated by multiplying the tick size by the contract size. In the E-mini S&P 500 futures, a tick size of $0.25 and a contract size of 50 result in a tick value of $12.50.
Here is a table summarising the differences between tick size and tick value:
|
Feature |
Tick Size |
Tick Value |
|
Definition |
The smallest price increment a security can move |
The monetary value of a single tick movement |
|
Set By |
Regulatory bodies or exchanges |
Calculated based on tick size and contract/shares |
|
Measurement |
Static measure (e.g., $0.01, ₹0.05) |
Dynamic measure (varies with trade specifics) |
|
Purpose |
Standardises price movements |
Determines profit/loss per tick movement |
|
Impact on Trading |
Influences bid-ask spread and market liquidity |
Affects trading costs and profitability |
|
Market Relevance |
Crucial for liquidity and efficient trading |
Key for calculating trade profits and losses |
Conclusion
Understanding tick size is essential for navigating the financial markets effectively. Whether you’re trading stocks, futures, or options, knowing the smallest price increment by which a security can move helps you make more informed decisions, manage trading costs, and develop effective strategies. Historical changes, such as the shift to decimalization, highlight the importance of regulatory efforts in improving market efficiency. By adapting to market conditions, leveraging technology, and ensuring regulatory compliance, you can optimise your trading performance. Mastering tick size concepts and their implications allows you to navigate the complexities of the market with greater confidence and precision.
Frequently Asked Questions about Tick Trading and Tick Size
How does tick size affect my trading strategy?
Tick size affects your trading strategy by influencing the precision of price movements and the cost of trading. Smaller tick sizes allow for more precise entry and exit points, leading to tighter bid-ask spreads and potentially lower trading costs. However, they can also increase the frequency of trades, which may raise transaction costs. Adjusting your strategy to account for tick size can help you optimise your trading decisions and manage costs effectively.
Why do different markets have different tick sizes?
Different markets have varying tick sizes to reflect their unique trading characteristics and regulatory requirements. For example, highly liquid markets with frequent trading activity, like large-cap stocks, often have smaller tick sizes to facilitate smoother price movements. In contrast, less liquid markets or those with higher volatility might have larger tick sizes to reduce market noise and provide clearer price trends. Regulatory bodies set these tick sizes to balance market efficiency, liquidity, and stability.
Can I choose the tick size I want to trade with?
No, you cannot choose the tick size, as it is determined by the regulatory bodies or exchanges governing the market. Tick sizes are set to standardise trading practices and ensure fair and efficient markets. However, you can adjust your trading approach to the given tick size by selecting the appropriate trading instruments and strategies that align with your objectives and market conditions.
How does tick size impact market liquidity?
Tick size impacts market liquidity by influencing the frequency and volume of trades. Smaller tick sizes typically enhance liquidity by encouraging more frequent trading and narrower bid-ask spreads, making it easier to buy and sell securities quickly. Conversely, larger tick sizes might reduce liquidity by creating wider spreads and less frequent price changes, but they can help highlight significant market trends and reduce trading noise.
Related Articles
What is CMP in the Stock Market?