
Quick Summary:
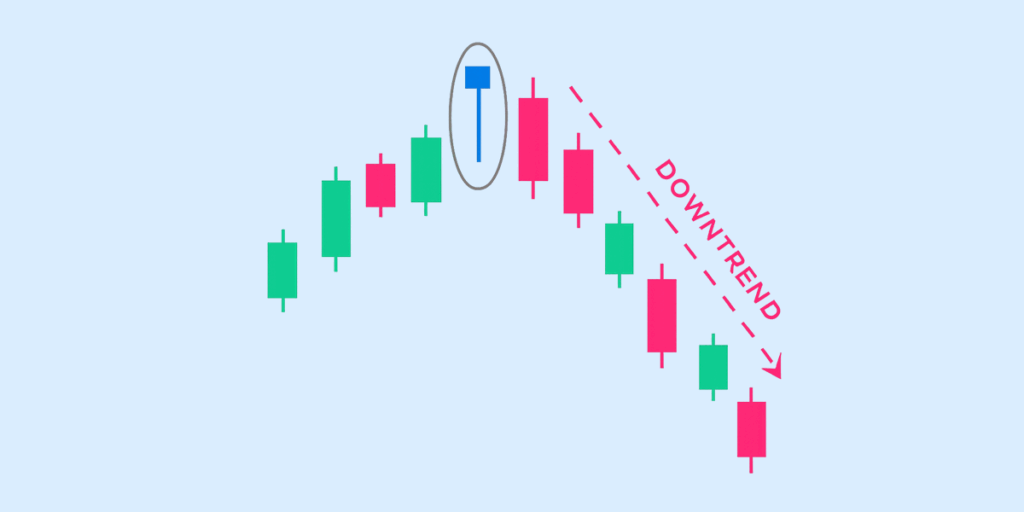
- A single-bar formation that occurs at the top of an uptrend is known as the Hanging Man candlestick pattern, and signifies a possible trend reversal or change.
- The Hanging Man has a small real body, with a long lower shadow and little to no upper shadow, signifying that selling pressure increased during this one period of time.
- While the pattern is not definitive to a downward movement, confirmation from the future price action would add further reliability to the candlestick pattern.
- Often times traders look for the Hanging Man candlestick as signs of potential bearish reversals within the market, especially appearing after a strong bullish run.
- It is always important to consider other technical tools and market conditions before building a trading decision solely upon this advanced candlestick pattern.
The Hanging Man candlestick pattern is a bearish reversal signal that typically appears at the top of an uptrend. It takes the shape of a single candle with a small real body near the top, a long lower shadow, and little to no upper wick, resembling a hanging figure.
This pattern suggests that although buyers managed to keep prices near the open, sellers dominated the session at some point, indicating potential weakness in the bullish trend. Keep reading to know more!
Hanging Man Candlestick Pattern – Meaning and Overview
The hanging man pattern candlestick forms when a stock or asset opens higher, sells off heavily during the day, but then recovers slightly to close near its opening price. The pattern suggests that sellers dominated part of the session, creating a long lower shadow, even though buyers managed to push prices back up before the close.
Structure of the Hanging Candle Pattern
- Small real body near the top (red or green)
- Long lower shadow at least twice the body size
- Minimal or no upper wick
- Forms at the top of an uptrend
The small body shows indecision, while the long shadow hints at growing bearish momentum. This makes the pattern useful for spotting weakness in bullish trends.
Why It Signals a Bearish Reversal
The hanging man candle’s meaning lies in its ability to warn traders of fading buying strength. After a strong uptrend, the formation of a hanging man shows that sellers are re-entering the market. The price may have recovered before the close, but the intraday drop signals that bulls are losing control.
However, traders usually wait for confirmation, such as a bearish candle the next day or a gap down, before acting on the signal.
Why it’s considered a bearish reversal pattern:
- Indicates exhaustion in an uptrend
- Shows that sellers are testing control.
- Highlights increased downside risk.
- Often used with volume analysis or indicators like RSI for confirmation.
How to Identify a Hanging Man Pattern on Charts
Identifying a Hanging Man pattern candlestick on stock charts involves looking for specific characteristics that signal a potential bearish reversal after an uptrend. This pattern stands out visually due to its distinct structure.
Key Characteristics of the Pattern
To recognise a hanging man candle, check for the following features:
- Small real body at the upper end of the candle range (can be red or green)
- Long lower shadow—at least twice the size of the real body
- Little or no upper shadow
- Occurs after a sustained uptrend
These elements reflect a session where sellers pushed prices significantly lower, but buyers managed to bring them back up near the opening price.
Candle Position and Shadow Importance
The position of the candle is critical—the pattern must appear at the top of an uptrend to have bearish significance.
- Lower Shadow: Indicates intraday selling pressure; its length is a vital signal of weakness in the trend.
- Small Body Near the Top: Suggests a recovery but also indecision.
- No Upper Wick or Very Short One: Reinforces the lack of bullish momentum during the session.
A red candle offers stronger confirmation than a green one, but both qualify as hanging man candlesticks if the structure fits.
Examples of Hanging Candle Patterns in Action
Here are a few real-market scenarios where the hanging man pattern typically appears:
- At the top of a bullish rally in a daily chart for a large-cap stock, signalling trend exhaustion before a correction.
- On a 4-hour chart during an intraday rally, showing short-term weakness and possible retracement.
- Before key resistance levels, suggesting that bulls may struggle to break through.
In each case, traders look for confirmation in the next candle (a strong red close or a gap down) before entering a short position or booking profits.
Types of Hanging Man Candlestick Pattern
The hanging man candlestick can appear in two main colour variations—red or green, each offering a slightly different level of bearish strength. Both types share the same structure but indicate varying degrees of reversal signals.
Red Hanging Man Candlestick
A red hanging man candlestick means the stock closed lower than it opened. This is considered a stronger bearish signal, as it shows that despite some recovery during the session, sellers maintained control by the close.
Key Takeaways:
- Signals stronger selling pressure
- Offers higher conviction of trend reversal
- Preferred by traders for bearish confirmation when followed by a red candle
Green Hanging Man Candlestick
A green hanging man candlestick means the stock closed higher than it opened. While the shape still indicates potential reversal, the close in the green shows that buyers were able to recover more ground.
Key Takeaways:
- Still valid as a hanging candle pattern
- Indicates initial selling, but buyer recovery
- Needs stronger confirmation from the next candle (e.g., a gap down or bearish close)
What the Hanging Man Pattern Tells Traders
The hanging man candlestick pattern provides insight into potential shifts in market sentiment. While it doesn’t guarantee a reversal, it acts as a cautionary signal for traders riding an uptrend. Here’s how:
Interpretation of the Hanging Man Candle Meaning
The hanging man candle’s meaning lies in its structure—a long lower shadow, a small real body at the top, and little to no upper wick. It tells traders that even during a bullish phase, sellers were able to push the price significantly lower within the session.
Although the price closed near its opening, this pattern highlights underlying weakness in the uptrend and the possibility of a shift in control from buyers to sellers. For many traders, it’s a signal to tighten stop-losses, reduce exposure, or watch closely for confirmation. Similar candlestick analysis is also used by investors who invest in US stocks from India to assess potential trend reversals and manage market risk more effectively.
Psychology Behind the Pattern
The psychology behind the hanging candle pattern reflects a loss of bullish momentum:
- The session opens strong, continuing the uptrend.
- Sellers aggressively drive the price down, creating a long, lower shadow.
- Buyers recover some ground but fail to close the session significantly higher.
This back-and-forth shows indecision and vulnerability, suggesting the uptrend may be overextended. The long lower wick symbolises panic selling, while the small body reflects buyers losing control—a red flag for bullish traders.
Role of Volume in Confirming the Pattern
Volume plays a key role in validating the strength of a hanging man pattern:
- High volume during the formation of the hanging man candle adds credibility to the signal. It shows that the sell-off wasn’t random but backed by broader market participation.
- Follow-up candle with high volume (especially a bearish one) strengthens the reversal signal, giving traders more confidence to act.
Low volume, on the other hand, may indicate that the price movement was not significant enough to justify a reversal.
How to Trade Using the Hanging Man Pattern
The hanging man pattern candlestick is most effective when used with confirmation and a disciplined approach. It’s not a standalone signal but a warning sign that a bullish trend may be losing momentum. Here’s how to trade around it.
Entry and Exit Strategy for Traders
Here are some entry and exit strategies for using the hanging man pattern:
Entry Strategy
- Do not enter a trade immediately after spotting the hanging candle pattern.
- Wait for confirmation—typically a red candle that closes below the hanging man’s real body.
- Conservative traders may enter a short position after confirmation, especially if it breaks a nearby support level or trendline.
Exit Strategy
- Consider booking profits at key support zones or near recent consolidation areas.
- Use trailing stop-losses to protect profits if the downtrend strengthens.
- Avoid holding trades without technical backing—wait for additional bearish signals.
Using Indicators for Confirmation (e.g., RSI, MACD)
Indicators can help confirm whether the hanging man pattern aligns with broader market signals:
- RSI (Relative Strength Index): A reading above 70 suggests the stock is overbought. If a hanging man forms while RSI is overbought, it adds weight to the bearish reversal signal.
- MACD (Moving Average Convergence Divergence): A bearish crossover (MACD line crossing below the signal line) after the pattern supports the possibility of a downward move.
- Volume Analysis: Higher volume during the hanging man or the confirmation candle strengthens the case for a reversal.
Risk Management Tips When Using This Pattern
Some risk management tips when using the hanging man candlestick pattern are:
- Use a Stop-Loss: Place it slightly above the high of the hanging man candle to limit potential losses if the pattern fails.
- Avoid Trading in Sideways Markets: The pattern works best at the end of strong uptrends. Avoid using it in choppy or non-trending markets.
- Position Sizing Matters: Don’t overcommit based on one pattern. Keep risk per trade within 1–2% of your capital.
- Always Wait for Confirmation: The hanging man is a warning, not a signal to act without confirmation.
Difference Between Hanging Man and Other Patterns
The hanging man candlestick pattern may look similar to other single-candle formations, but what sets it apart is where it appears in a trend and what it signals. Let’s look at how it compares with the hammer, shooting star, and doji patterns.
Hanging Man vs Hammer Candlestick
At first glance, the hanging man and hammer look almost identical — both have a small real body at the top of the range and a long lower shadow with little to no upper wick.
But the key difference lies in the trend context:
- The hanging man forms at the top of an uptrend and signals a bearish reversal, warning traders that selling pressure is increasing.
- The hammer appears at the bottom of a downtrend and signals a bullish reversal, suggesting that buyers are stepping in after heavy selling.
So, while the structure is the same, the interpretation is completely opposite depending on where the candle appears in the trend.
Hanging Man vs Shooting Star
Both are bearish reversal patterns that appear after an uptrend, but they differ in structure:
- The hanging man has a long lower shadow and a small body at the top.
- The shooting star has a long upper shadow and a small body near the bottom, indicating that buyers pushed prices up but sellers took over by the close.
Hanging Man vs Doji
A doji forms when the opening and closing prices are nearly equal, creating a candle with almost no real body. Its shadows can vary, and it represents indecision, not clear selling pressure.
In contrast, the hanging man has a small but defined real body and a long lower shadow—a sign that sellers were active, even if the price recovered by close.
Conclusion
The hanging man candlestick is a visual warning that the uptrend may be losing strength. While it doesn’t guarantee a reversal, it highlights increased selling pressure and a shift in sentiment.
When combined with confirmation signals like volume spikes or bearish follow-up candles, it can become a useful tool for timing exits or initiating short trades. Understanding and correctly interpreting this pattern can help you respond to market shifts more confidently.
FAQs
What is the Hanging Man candlestick pattern in trading?
The Hanging Man candlestick pattern in trading is a bearish reversal signal that appears after an uptrend. It shows that selling pressure is rising, and a potential price reversal may occur. This pattern has a small body near the top, a long lower shadow, and little to no upper wick, resembling a “hanging” figure.
How do I identify a hanging man pattern on a stock chart?
To identify a Hanging Man pattern on a stock chart, look for a single candle at the top of an uptrend with a small real body near the high, a long lower shadow, and almost no upper wick. This hanging man candle structure suggests intraday selling that was overcome, but could indicate weakness in the trend.
Is the hanging man pattern always a bearish signal?
The Hanging Man pattern is generally a bearish signal, but not always. It hints at a possible trend reversal due to selling pressure, but traders usually wait for confirmation, such as a lower close on the next candle, before acting on the signal.
What’s the difference between a hanging man and a hammer candle?
The difference between a Hanging Man and a Hammer candle lies in their trend context. Both have similar shapes (small body and long lower shadow), but a Hammer appears after a downtrend and signals a bullish reversal. In contrast, a Hanging Man forms at the top of an uptrend and suggests a potential bearish reversal.
How can I confirm a hanging man pattern before trading?
To confirm a Hanging Man pattern before trading, check for a bearish candle that closes below the Hanging Man’s body on the following day. A gap down or higher trading volume can strengthen the signal. You can also cross-check with technical indicators like RSI or moving averages for added confirmation.
Disclaimer
The information provided in this article is for educational and informational purposes only. It should not be considered as financial or investment advice. Investing in stocks involves risk, and it is important to conduct your own research and consult with a qualified financial advisor before making any investment decisions. The author and publisher are not responsible for any financial losses or gains that may result from the use of this information.


