
The piercing pattern is a two-candle bullish reversal pattern used in candlestick charting. It helps traders spot potential turning points after a downtrend by highlighting a shift from selling pressure to renewed buying interest.
Candlestick patterns are visual representations of price action over a specific time frame. Each candle shows the open, high, low, and close, making it easier to identify trends, reversals, or market indecision.
Traders use these patterns in technical analysis to make short-term trading decisions based on past price behaviour. Within this family, the piercing candle pattern is known for signalling a possible bottom, where the momentum shifts from bears to bulls.
Keep reading to know more!
What Is the Piercing Line Candlestick Pattern?
The piercing line candlestick pattern is a two-day bullish reversal pattern that appears after a downtrend. It signals a potential shift from selling pressure to buying interest, which makes it a very useful tool for traders looking to enter long positions or exit short trades.
In the piercing pattern, the first candle is a long bearish (red) candle that continues on the downtrend. The second candle—the piercing candle pattern—opens below the previous day’s close, creating a gap down. But then closes above the middle point of the previous candle’s body. This price action indicates that buyers have stepped in aggressively, reversing a portion of the prior losses.
The bullish piercing pattern is usually a sign that selling momentum is fading and a near-term recovery/reversal can follow. However, the signal is strongest when supported by other indicators like volume spikes, RSI divergence, or proximity to support levels.
Key Characteristics of the Bullish Piercing Pattern
The bullish piercing pattern is most meaningful when it forms after a clear downtrend and reflects a strong counter-move by buyers. Some key features that will help you differentiate valid setups from weak ones and time your entries with more confidence.
- Appears after a downtrend: The pattern signals a potential reversal only when it forms after sustained price declines.
- First candle – long red (bearish): This shows strong selling pressure, confirming that bears were in control of the previous session.
- Second candle – long green (bullish): The green candle opens below the prior close (gap down), then closes above the midpoint of the last red candle — effectively “piercing” into it.
- Strong reversal signal when combined with volume: A rise in volume on the second candle strengthens the validity of the pattern, indicating that buyers are stepping in with conviction.
Market Psychology Behind the Piercing Pattern
The piercing line candle pattern reflects a shift in sentiment, from bearish dominance to bullish interest, often driven by emotion, market overreaction, and opportunistic buying.
What Bulls and Bears Are Thinking
- First Candle (Bearish): Bears are in control. The strong red candle suggests continued pessimism and possibly panic selling. Bulls are either sidelined or cautious, unwilling to enter the market yet.
- Second Candle (Bullish): The market opens with a gap down, reinforcing bearish sentiment. However, buyers step in—possibly due to perceived overselling, value buying, or short-covering—and drive the price up sharply. The close above the midpoint of the previous candle signals that bulls are now challenging bearish control. Similar price action principles are also useful for investors who invest in US stocks from India, as candlestick patterns are widely used across global equity markets.
Why It Signals a Change in Sentiment
The piercing candle pattern reflects a clear rejection of lower prices. The gap down fails to sustain as buying demand increases. This recovery into the prior day’s losses suggests that sellers are weakening and that buyers see value at current levels—a possible sign of trend reversal.
Role of Fear, Profit Booking, and Bargain Buying
Fear pushes traders to sell during the first candle, often amplifying the downtrend. On the other hand, profit booking by short-sellers and bargain buying by value seekers drive the second candle upward.
The outcome is a visible shift in momentum, as demand begins to outweigh supply, which is the core psychological driver behind the bullish piercing pattern.
How to Trade Using the Piercing Pattern
The piercing pattern offers a clear signal of bullish momentum, but it should be used with confirmation and proper risk management. Here’s how you can trade the piercing line candle pattern effectively:
The piercing line candle pattern gives a potential entry point during a trend reversal from bearish to bullish. But—like most candlestick signals—it works best when combined with confirmation tools and sound risk management.
Start by identifying a valid bullish piercing pattern, typically seen on daily or weekly charts after a sustained downtrend. Once this is confirmed, you can build a trade setup around the following key elements:
Entry and Exit Strategy
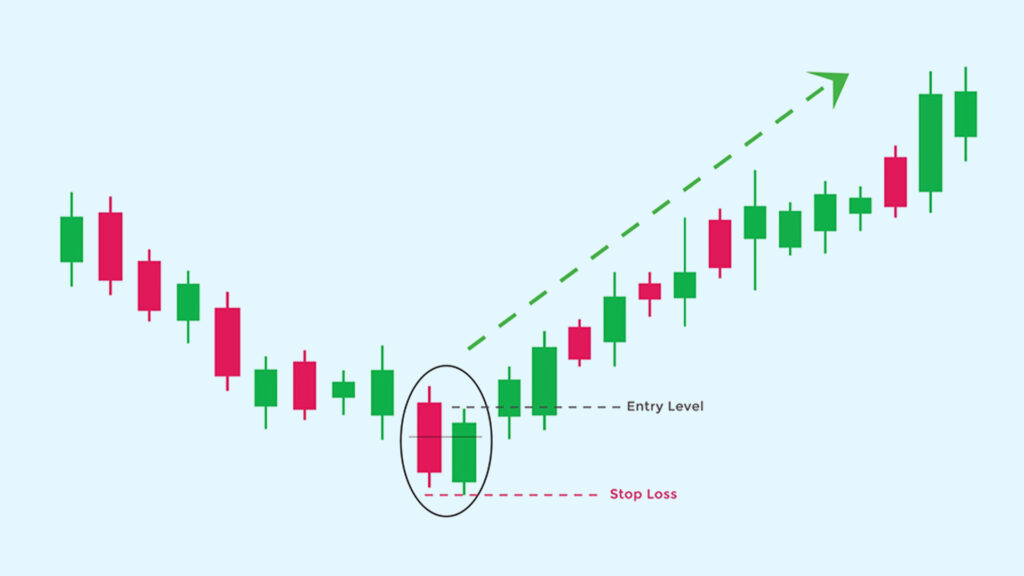
Enter the trade when the price breaks above the high of the second (bullish) candle. This confirms that buying momentum is continuing beyond the initial reversal.
For exits, look at nearby resistance levels, previous swing highs, or you can also use Fibonacci retracement levels as profit targets. A trailing stop can also help capture extended moves.
Stop-Loss Placement
To manage risk, place your stop-loss just below the low of the second candle in the piercing candle pattern. This protects against false breakouts. In more conservative setups, you may place the stop slightly below the low of the first (bearish) candle for added buffer.
Confirming the Signal
Relying on the piercing line pattern alone may not be enough. Confirmation improves reliability:
- Volume: Higher volume on the bullish candle suggests strong buyer interest.
- RSI: A bounce from the oversold zone or a bullish divergence supports the reversal view.
- Trendlines or support zones: If the pattern appears near a known support or trendline, it adds credibility to the setup.
Best Timeframes for Trading
The piercing pattern is most effective on daily charts, where it helps spot medium-term trend reversals. On weekly charts, it can signal longer-term entry opportunities. Intraday timeframes are less reliable, as price noise can lead to more false signals.
Piercing Pattern vs Other Bullish Reversal Patterns
Here’s a comparison of the piercing line pattern with two other popular bullish reversal setups—the bullish engulfing and the morning star. While all three indicate potential upward reversals, their structure and strength vary based on market context. Here’s how:
| Feature | Piercing Pattern | Bullish Engulfing | Morning Star |
| Candles Involved | 2 | 2 | 3 |
| Pattern Structure | Second bullish candle opens below prior close and closes above the midpoint | The second bullish candle completely engulfs the past bearish candle | Bearish candle → small-bodied candle → strong bullish candle |
| Signal Strength | Moderate to strong (requires confirmation) | Strong when confirmed by volume or support level | Strong, especially with a long final bullish candle |
| Gap Required? | Yes, the second candle opens below the previous close | Not necessary | Yes, small-bodied candle often gaps down before a reversal |
Limitations of the Piercing Pattern
While the piercing line pattern is a widely recognised bullish reversal signal, it comes with certain limitations that you should consider before acting on it.
- Works best in trending or oversold markets: The pattern is more effective when it forms after a clear downtrend or in oversold conditions. In weak or unclear trends, it may not hold much significance.
- Not reliable in sideways or low-volume conditions: In range-bound markets or during low trading volume, the piercing candle pattern can produce false signals, as price moves may lack conviction.
- Needs confirmation—don’t trade in isolation: A valid bullish piercing pattern still requires confirmation from the next candle or technical indicators like RSI or trendline support. Trading it in isolation can increase the risk of premature entries.
Conclusion
The piercing line candle pattern is a reliable bullish reversal signal when used in the right context, typically after a downtrend or in oversold markets. Its structure reflects a clear shift in momentum from sellers to buyers, which makes it an extremely valuable tool for spotting potential entry points.
However, like all candlestick patterns, the piercing pattern should not be used in isolation. Always confirm the signal with supporting indicators (RSI, MACD, volume, or key support levels). Take time to backtest the pattern across different stocks and timeframes before applying it in live markets. This will help build your confidence and understand how it behaves in real trading conditions.
FAQs
What does the piercing pattern indicate in trading?
The piercing pattern signals a potential bullish reversal after a downtrend. It suggests that buying pressure is coming back as the second candle closes deep into the body of the previous bearish candle.
How can I identify a bullish piercing candle pattern?
To identify a bullish piercing candle pattern, look for a two-day formation:
- Day 1: A long red (bearish) candle.
- Day 2: A green (bullish) candle which opens below the last close and closes above the midpoint of the red candle.
This structure defines a valid bullish piercing candle pattern.
Is the piercing pattern reliable for intraday trading?
The piercing pattern is more reliable on daily or weekly charts. It can appear on intraday charts, but false signals are more common due to market noise. Use additional indicators for confirmation if trading intraday.
What is the difference between the piercing pattern and the engulfing pattern?
Both are bullish reversal patterns, but the piercing pattern only closes above the midpoint of the previous candle. In contrast, the bullish engulfing pattern completely covers or “engulfs” the prior bearish candle.
How to confirm a piercing line candle pattern before entering a trade?
Confirm the piercing line pattern by checking for:
- A break above the second candle’s high.
- Rising volume on the second candle.
- Support from indicators like RSI (moving up from oversold) or a trendline bounce.
This helps filter out weak setups and improves trade accuracy.
Disclaimer
The information provided in this article is for educational and informational purposes only. It should not be considered as financial or investment advice. Investing in stocks involves risk, and it is important to conduct your research and consult with a qualified financial advisor before making any investment decisions. The author and publisher are not responsible for any financial losses or gains that may result from the use of this information.


