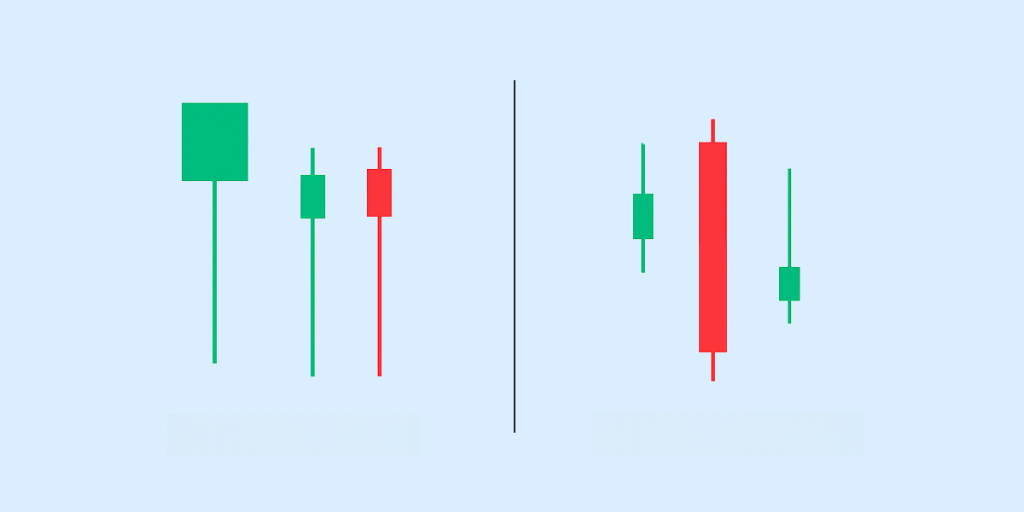
Candlestick patterns, dating back to the 18th century, were first used by Munehisa Homma, a Japanese rice trader. He noticed that market prices were influenced not just by supply and demand, but also by traders’ emotions.
Today, over 81 candlestick patterns help traders understand market trends and behaviours, reflecting the ongoing battle between optimism and pessimism in trading. If you’re looking to sharpen your trading decisions, keep reading to explore how candlestick patterns can transform your approach to trading.
1. Why Use Candlesticks?
Traders prefer candlestick charts because they consolidate data from multiple time frames into single price bars. This makes it easier to see and interpret market trends and reversals. The visual difference between bullish and bearish movements represented by green and red colours enables traders to swiftly measure market sentiment.
1.1 Candlestick Characteristics
Body Length: The body of the candlestick shows the range between the opening and closing prices.
- A long body indicates strong buying or selling pressure. This depends on whether the candle is bullish (price closed higher than it opened) or bearish (price closed lower than it opened).
- Conversely, a short body suggests little price movement and indecision in the market.
Wick Length: Wicks, or shadows, on candlesticks, stretch from the body to mark the session’s highest and lowest prices. Long wicks indicate uncertainty and potential trend reversals, reflecting volatility with prices not holding beyond the candle’s core range.
Prior Trend: Candlestick patterns gain meaning from the trend they follow; a bullish pattern after a downtrend might signal a reversal. Trends can be spotted through sequences of higher lows (uptrend) or lower highs (downtrend).
2. What Are Candlestick Patterns?
Candlestick patterns are visual representations of price movements displayed on a candlestick chart. They provide insights into market sentiment and potential price direction based on the historical data of open, high, low, and close prices.
3. Do Candlestick Patterns Work?
Yes, candlestick patterns work because they visually capture the market’s mood and show trends like optimism through higher highs and lows without closing below previous lows.
They offer clarity in the fast-paced share market, cutting through noise to reveal price action and sentiment. They operate on the idea that price moves in recognisable patterns, helping traders identify and act on these patterns.
4. Types of Candlestick Patterns
4.1 Bearish Candlestick Patterns
- Hanging Man: Suggests a potential reversal of an uptrend.
- Bearish Engulfing: Shows bears overpowering bulls, usually indicating a downward turn.
- Bearish Pinbar Reversal Candlestick Pattern: Indicates a rejection of higher prices and potential downward movement.
- Evening Star: A three-candle pattern signalling the end of an uptrend.
- Three Black Crows: This represents a strong bearish reversal with three consecutive long, red candles.
- Shooting Star: A single candle indicating a potential downturn after an uptrend.
- Dark Cloud Cover: A two-candle pattern where the second opens high but closes below the midpoint of the first candle’s body, signalling a bearish reversal.
4.2 Indecision Candlestick Patterns
These patterns typically indicate a pause or struggle for direction between buyers and sellers, not suggesting a clear trend. These patterns usually have small bodies or big wicks, showing that traders are unsure. This can mean the market might soon change or keep going once everyone decides.
4.3 Bullish Candlestick Patterns
- Hammer Candlestick Pattern: Often found at the bottom of a downtrend, suggesting a reversal upwards.
- Inverse Hammer: A price pattern that can indicate a bullish reversal.
- Bullish Engulfing: A pattern where a larger green candle fully engulfs a smaller red candle, predicting upward momentum.
- Piercing Line: A two-candle bullish reversal pattern that occurs at the end of a downtrend.
- Morningstar Candlestick: A three-candle pattern that signals a bullish reversal after a downtrend.
- Three White Soldiers: A strong bullish reversal pattern characterized by three consecutive long green candles.
5. How to Read Candlestick Patterns?
Reading candlestick patterns involves looking at the shapes and sizes of candles within a chart context.
- Start by identifying the overall market trend before the pattern appears.
- Patterns like the Hammer or Bullish Engulfing suggest buying opportunities when they occur after a price decline.
- Conversely, patterns like the Hanging Man or Bearish Engulfing may warrant a sale if they follow a price increase.
- Using multiple candlestick patterns and indicators like Bollinger Bands can enhance trading strategies. For example, spotting a bullish or bearish engulfing pattern near the Bollinger Bands’ edges can signal trend reversals or breakouts, guiding more precise trading decisions.
6. Final Thoughts
Understanding candlestick patterns offers a distinct edge in trading. For an enhanced trading experience, consider using the Appreciate Wealth platform. Our trading app provides tools and resources designed to empower your trading journey.
FAQs
1. What is the most powerful candlestick pattern?
The Bullish Engulfing and the Bearish Engulfing patterns are both powerful, signalling strong market reversals. This makes them highly influential for traders.
2. Are chart patterns effective across different financial markets?
Yes, chart patterns are effective across different financial markets such as stocks, forex, and commodities. They help traders to decipher market sentiments and make predictions based on price actions.
3. Do professional traders use candlestick patterns?
Many professional traders use candlestick patterns as part of their analysis toolkit to make informed decisions about entry and exit points.
4. What is the 3 candle rule?
The 3 candle rule refers to a trading strategy that waits for a confirmation of the market direction from three consecutive candlesticks before making a trade decision.
5. Which kind of trader benefits most from utilising candlestick patterns?
Both novice and experienced traders benefit from using candlestick patterns. They are especially valuable for day traders and technical analysts who rely on short-term price movements.


