Quick Summary:
Stock market traders use Technical analysis to predict future price movements by studying historical market data, specifically focusing on price trends and trading volumes rather than a company’s financial health. The core principles of technical analysis are that prices reflect all available information. Some tools that traders use to predict price movements include moving averages, RSI (Relative Strength Index), MACD (Moving Average Convergence Divergence), and candlestick patterns. These tools help them spot potential buying or selling opportunities. The article also explains different types of charts, how to identify market trends, and the significance of support and resistance levels in making informed trading decisions.
What is Technical Analysis?
Technical analysis is a trading approach that uses historical market data, primarily price and volume, to forecast future price movements. Traders and investors also use various charting tools and indicators to identify potential buying or selling opportunities, with the idea that past price behaviour can signal future movements.
Also Read: Difference Between Fundamental and Technical Analysis
Key Principles of Technical Analysis
Technical analysis is based on three core principles that guide traders in their analysis of market movements:
Price Discounts Everything
This principle suggests that all available market information—from a company’s fundamentals to investor sentiment and broader economic factors—is already reflected in a stock’s price. As a result, technical analysts believe that studying price movements alone provides all the data needed to make trading decisions.
Price Moves in Trends
A key belief in technical analysis is that price movements follow identifiable trends. Whether upward, downward, or sideways, prices are more likely to continue following an established trend than to move randomly. Traders use trendlines, moving averages, and other tools to recognize and follow them, making it easier to decide when to enter or exit a trade.
History Tends to Repeat Itself
Traders believe that human emotions, such as fear and excitement, cause certain market patterns to repeat over time. Technical analysts can anticipate future price movements by identifying and studying historical patterns, such as head-and-shoulders or double tops.
Pro Tip: If you’re seeking to maximise your returns, investing in emerging markets with high growth potential is a great opportunity. If you prefer investing mostly in companies that are global leaders in their respective industries, consider investing in US stocks.
Tools and Indicators for Technical Analysis
When analyzing stocks, traders use various technical tools and indicators to make informed trading decisions. Some of these include:
Moving Averages
Moving averages smooth out price data to identify trends. There are two main types:
- Simple Moving Average (SMA): This method averages the price over a set period, making it easier to spot overall trends.
- Exponential Moving Average (EMA): This indicator gives more weight to recent prices, making it more responsive to current market conditions.
Relative Strength Index (RSI)
The RSI is a momentum oscillator that helps traders determine if a stock is overbought or oversold. It ranges from 0 to 100, with:
- Above 70, indicating overbought conditions (potential sell signal).
- Below 30 indicating oversold conditions (potential buy signal).
Moving Average Convergence Divergence (MACD)
MACD measures the relationship between two moving averages and is used to identify changes in momentum. Key points include:
- When the MACD line crosses above the signal line, it signals a potential buy.
- When the MACD line crosses below the signal line, it suggests a sale.
Bollinger Bands
Bollinger Bands are volatility indicators consisting of a middle band (SMA) and two bands above and below it. Traders use them to identify potential buy and sell opportunities:
- Price near the upper band indicates overbought conditions (sell signal).
- Price near the lower band indicates oversold conditions (buy signal).
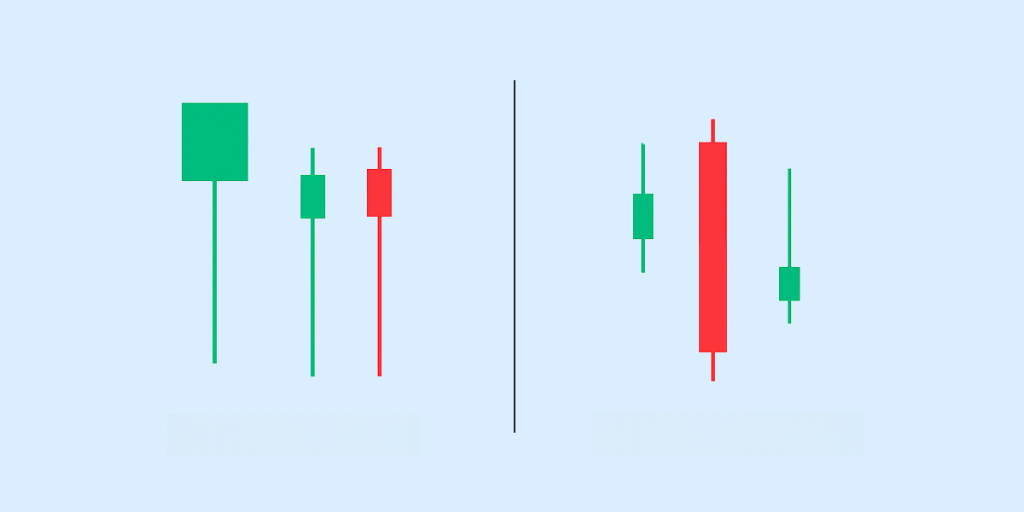
Candlestick Patterns
Candlestick charts provide visual cues about market sentiment. Common patterns include:
- Hammer: Signals potential reversal after a downtrend.
- Doji: Indicates market indecision, often before a trend change.
- Engulfing Pattern: A reversal pattern where a larger candle engulfs a smaller one, signaling a trend reversal.
Types of Technical Analysis Charts
Below are the most common charts used by traders.
Line Chart
A line chart connects a series of closing prices with a continuous line. It’s simple and ideal for spotting overall trends over time, but it doesn’t show price ranges, making it less useful for intraday trading.
Bar Chart
A bar chart displays each period’s open, high, low, and close prices. The vertical bar represents the range between the high and low, while horizontal lines on either side indicate the open (left) and closed (right) prices.
Candlestick Chart
Candlestick charts provide a more visual representation of price action, showing each period’s open, close, high, and low. The candle’s body represents the range between the opening and closing, with wicks extending to the high and low points.
Trends and Trendlines in Technical Analysis
Understanding trends and how to use trendlines is essential for traders to identify price movements and make informed decisions. Here’s a more in-depth explanation.
Identifying Trends
Trends refer to the general direction of a stock’s price movement over a given period:
- Upward trend: A series of higher highs and higher lows. Traders look for buying opportunities, assuming prices will continue to rise.
- Downward trend: A series of lower highs and lower lows. In this case, traders often sell or short, anticipating further declines.
- Sideways trend: Price moves in a narrow range without a clear upward or downward direction. Traders may wait for a breakout in either direction to act.
Drawing Trendlines
Trendlines are straight lines drawn on a chart to visually represent the direction of the price. Here’s how to draw them:
- Uptrend lines: Drawn by connecting two or more lows in an uptrend. This line acts as a support level, indicating areas where the price may bounce back up if it falls.
- Downtrend lines: Drawn by connecting two or more highs in a downtrend. These lines represent resistance, where prices may struggle to rise and could reverse direction.
Support and Resistance Levels
In technical analysis, support and resistance levels allow traders to identify potential entry and exit points, helping them make more informed decisions about their trades. Let’s examine this in more detail.
Identifying Support Levels
Support levels represent the price range where a stock’s decline typically halts as demand increases. Traders often look at historical data to spot these areas, using them as points where they expect buyers to step in and prevent further price drops.
Identifying Resistance Levels
On the other hand, resistance levels are areas where the stock’s upward momentum typically slows down due to increased selling activity. These levels act as a ceiling for the stock price, where sellers gain control, preventing further upward movement.
How to Use Technical Analysis in Stock Trading
Technical analysis helps you identify trends, predict price changes, and find entry or exit points in the market. Some strategies to do this effectively are:
Selecting the Right Stocks for Technical Analysis
To begin with, you need to choose the right stocks for technical analysis. Focus on liquid stocks—those with high trading volumes—because they tend to have more predictable price movements. Additionally, prioritize stocks with volatility, as price fluctuations create more opportunities for trading, making it easier to apply technical analysis effectively.
Combining Multiple Indicators
Relying on just one indicator can limit your ability to confirm market trends, so combining multiple tools for a more accurate analysis is common practice. For example, pairing the Relative Strength Index (RSI) with moving averages gives you a broader view of market momentum.
Managing Risk with Technical Analysis
Risk management is crucial; technical analysis offers tools to minimize potential losses. For instance, stop-loss orders are a great way to protect your investment by automatically selling a stock if its price drops below a set point.
The Bottom Line
Technical analysis helps traders identify patterns, understand market sentiment, and make informed decisions about when to enter or exit trades. By leveraging key technical indicators, investors can gain valuable insights into market behavior and increase their chances of making profitable trades.
Platforms such as Appreciate Trading App provide investors with comprehensive technical analysis tools, allowing them to evaluate U.S. stocks effectively and make smarter, data-driven trading decisions.
FAQs
What is technical analysis in stock trading?
Technical analysis evaluates securities by analyzing statistical trends gathered from trading activity, such as price movement and volume. It uses historical data to predict future price movements, helping traders make informed decisions.
How does technical analysis differ from fundamental analysis?
Technical analysis focuses on price movements and market trends, while fundamental analysis examines a company’s financial health, including revenue, earnings, and industry position.
What are the best indicators for technical analysis?
Some of the most popular indicators include moving averages, relative strength index (RSI), and MACD (Moving Average Convergence Divergence). These tools help traders identify trends, momentum, and potential reversals in stock prices.
What is the RSI, and how is it used in technical analysis?
The RSI (Relative Strength Index) measures the speed and change of price movements, oscillating between 0 and 100. Traders use it to identify overbought or oversold conditions, with values above 70 indicating overbought and below 30 indicating oversold.
What are candlestick patterns?
Candlestick patterns are chart formations used to predict future price movements based on past price behavior. They provide visual representations of market sentiment and can indicate potential reversals or continuations in trends.
How do moving averages help in technical analysis?
Moving averages smooth out price data to create a single flowing line, making it easier to identify trends. They are commonly used to determine support and resistance levels and to signal potential buying or selling opportunities.
What are support and resistance levels?
Support levels are price points where a stock tends to stop falling due to increased buying interest. Resistance levels are points where the stock tends to stop rising, as selling pressure typically increases at these prices.
How do I use trendlines in technical analysis?
Trendlines are drawn on charts to connect a series of highs or lows, helping traders identify the direction of a stock’s movement. They are used to spot trends and potential reversal points by showing the general direction of price action over time.
Can I combine multiple technical indicators for better trading decisions?
Yes, many traders use a combination of indicators to confirm signals and reduce the likelihood of false predictions. For example, using moving averages alongside RSI or MACD can help increase the accuracy of trend identification.
Is technical analysis suitable for beginners?
Technical analysis can be useful for beginners but requires a basic understanding of charts and indicators. With practice and study, new traders can gradually learn to apply it effectively in their trading strategies.
Disclaimer: Investments in securities markets are subject to market risks. Read all the related documents carefully before investing. The securities quoted are exemplary and are not recommendatory.


