A dark cloud cover pattern is a bearish reversal signal observed on candlestick charts. It typically appears after an uptrend and alerts traders to a possible shift in momentum from buying to selling. This pattern is made up of two candles — a strong bullish candle followed by a bearish one that opens above the previous close but closes below its midpoint.
Candlestick charts, widely used in technical analysis, display price movement in a visual format. Each candle shows the open, high, low, and close of a security in a specific time frame. The Dark Cloud Cover pattern is significant because it captures a sharp shift in market sentiment, from buyers driving prices up to sellers overpowering that move.
Read along to know more!
Structure and Key Characteristics
To correctly identify a dark cloud cover candlestick pattern, you need to understand how price behaves across two consecutive sessions, specifically through the open, high, low, and close (OHLC) values.
Key Components of a Dark Cloud Cover Pattern
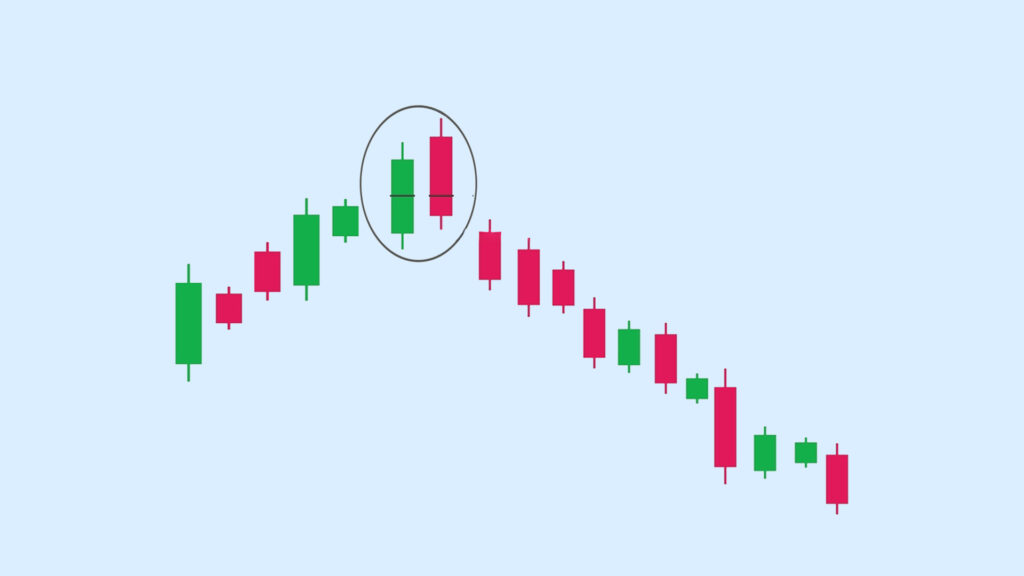
The dark cloud cover pattern forms after a clear uptrend and consists of two distinct candles:
- First candle (bullish):
- Opens lower and closes near the high of the session.
- Shows strong buying pressure.
- Second candle (bearish):
- Opens above the prior candle’s close (gap up).
- Closes below the midpoint of the first candle’s body.
- Signals a clear shift in momentum from buyers to sellers.
For a valid dark cloud cover candle pattern, the second candle must:
- Start with a gap up (open above the previous close).
- Close well into the bullish candle’s body — ideally below its midpoint.
- Appear after a sustained uptrend (not in isolation).
If the second candle fails to meet these conditions, it may indicate weakening momentum but not a strong reversal.
Ideal Timeframes for Accuracy
The dark cloud cover candlestick pattern is most reliable on:
- Daily charts; widely used for short to medium-term analysis.
- Hourly charts; suitable for active traders, though more prone to noise.
- Weekly charts; useful for broader context but less common for this pattern.
For best results, use the dark cloud cover candlestick pattern along with confirmation tools like trendlines, volume spikes, or momentum indicators. This improves the accuracy of signals and helps you avoid false setups.
This is also relevant for those learning how to invest in US stocks from India and apply technical patterns across global markets.
Market Psychology Behind the Pattern
The dark cloud cover candlestick pattern reflects a clear shift in market sentiment—from bullish optimism to bearish caution. Traders often interpret this change in momentum as a warning that buyers are losing control and that the selling pressure is building.
The first candle shows strong buying interest, usually seen in an ongoing uptrend. But when the second candle opens higher and closes deep into the prior candle’s body, it signals that sellers have stepped in aggressively. This sudden dominance by sellers—especially after a gap-up open—suggests that the prior optimism may have been overextended.
Institutional traders and large funds often monitor patterns like the dark cloud cover to spot overbought conditions. If the second candle confirms selling strength, it may be used to reduce long positions or build short positions, especially near resistance zones or after a prolonged rally.
When supported by volume spikes or other bearish indicators, this dark cloud cover candle pattern becomes a trigger for strategic reversals.
Bullish vs Bearish Behaviour in Dark Cloud Cover
The dark cloud cover candlestick pattern, usually, is a bearish reversal signal, but its reliability depends heavily on market context.
When It’s More Reliable
The dark cloud cover pattern is more dependable when it forms:
- In overbought zones, where prices have risen too quickly without healthy corrections.
- Near resistance levels, where the price has historically struggled to move higher.
- After a strong uptrend, as a signal of potential exhaustion among buyers.
In these cases, the second bearish candle acts as a warning that the upside momentum is weakening and sellers are getting their control back.
False Signals: How to Avoid Common Mistakes
Not every dark cloud cover candlestick results in a reversal. False signals can occur when:
- The prior trend is unclear or sideways.
- The second candle closes just above the midpoint of the first candle.
- The pattern forms without a gap-up open.
To reduce false signals:
- Wait for confirmation on the next candle (a lower close).
- Use other tools like moving averages or RSI to confirm overbought conditions.
- Avoid trading the pattern in choppy or low-volume markets.
Importance of Volume in Confirmation
Volume adds credibility to the dark cloud cover candle pattern. A strong bearish candle formed with higher-than-average volume shows that sellers were actively stepping in, not just a temporary pause.
Conversely, if the pattern forms on low volume, it may reflect a lack of interest rather than actual reversal strength.
Combining volume analysis with the dark cloud cover candlestick pattern gives you a better chance of filtering out weak setups and focusing on high-probability trades.
How to Trade Using the Dark Cloud Cover Pattern
The dark cloud cover candlestick pattern can offer valuable trade setups, especially when it forms after an extended uptrend or near a key resistance zone. To effectively trade this pattern, combine it with confirmation tools like RSI, MACD, or volume indicators, and follow structured risk management.
Ideal Entry and Exit Points
- Entry: Wait for confirmation. Enter a short position once the price moves below the low of the second candle in the dark cloud cover pattern. This will confirm that sellers are maintaining control.
- Exit: Identify nearby support zones or use Fibonacci retracement levels as potential profit targets. For a flexible approach, use a trailing stop-loss to stay in the trade as long as the trend remains bearish.
Best Stop-Loss Strategy
- Place the stop-loss just above the high of the second (bearish) candle in the dark cloud cover candlestick pattern. This protects against false signals and unexpected breakouts.
- Alternatively, if the pattern forms near a key resistance level, place the stop-loss slightly above that level.
Trade Example: Reliance Industries
Let’s say Reliance (NSE: RELIANCE) is in an uptrend and trading near ₹2,850. A strong bullish candle forms, closing at ₹2,860. The next day, the price gaps up to ₹2,870 but closes sharply lower at ₹2,810, well below the midpoint of the previous candle.
- Entry: Short at ₹2,805 after price breaks below the bearish candle’s low.
- Stop-loss: ₹2,875 (just above the second candle’s high).
- Target: ₹2,740 (near the recent support zone or 50% Fibonacci retracement).
Combining with RSI, MACD, or Moving Averages
To increase the reliability of the dark cloud cover candle pattern, use it alongside key technical indicators:
- RSI (Relative Strength Index): If RSI is above 70 (overbought zone) and starts turning down, it adds strength to the bearish reversal signal.
- MACD (Moving Average Convergence Divergence): A bearish crossover—where the MACD line falls below the signal line—confirms weakening momentum.
- Moving Averages: If the pattern forms near or just below a long-term moving average (like the 50 or 200 EMA), it reinforces the potential reversal.
Dark Cloud Cover vs Other Bearish Candlestick Patterns
The dark cloud cover candlestick pattern is just one of several bearish reversal signals used in technical analysis. Here’s how it compares with other popular patterns:
| Feature | Dark Cloud Cover | Bearish Engulfing | Evening Star | Shooting Star |
| Candles Involved | 2 | 2 | 3 | 1 |
| Pattern Structure | Bearish candle opens above prior bullish close and closes below the midpoint | The bearish candle completely engulfs the prior bullish candle | Bullish candle → small-bodied candle → strong bearish candle | Small body with long upper wick, little or no lower wick |
| Trend Context | Appears after an uptrend | Appears after an uptrend | Appears at the end of an uptrend | Appears after a price rally |
| Key Reversal Signal | Shift in momentum from buyers to sellers | Sellers overpower buyers completely | Momentum peaks and reverses over three sessions | Buying pressure fades; potential reversal warning |
| Common Timeframes | Daily > Hourly > Weekly | Daily and above | Daily and above | All timeframes |
| Reliability | High (with volume and resistance level) | High (with trend and volume confirmation) | Moderate to high (when all 3 candles form clearly) | Moderate – prone to false signals without confirmation |
Limitations of the Dark Cloud Cover Pattern
The dark cloud cover candlestick pattern is a widely used bearish reversal signal, but it comes with certain limitations that traders must consider.
- It doesn’t guarantee a reversal: The pattern signals a potential shift in momentum, but not every occurrence leads to a confirmed downtrend. Price may continue rising after a brief pause, especially if there’s strong underlying buying interest.
- It needs confirmation: Relying on the dark cloud cover pattern alone can result in false signals. You should always look for confirmation through technical indicators like RSI, MACD, or a trendline break before entering a trade.
- Less effective in sideways markets: This pattern performs best when it forms after a clear and extended uptrend. In range-bound or sideways conditions, its reliability drops, as short-term reversals are less meaningful and may not lead to sustained moves.
Final Thoughts
The dark cloud cover candlestick pattern is an excellent bearish signal that highlights a shift in market sentiment, from buying strength to selling pressure. However, you should always be treat it as a confirmatory signal, not a standalone trigger.
For better accuracy, use the dark cloud cover pattern along with other technical tools such as volume analysis, RSI, MACD, moving averages, or support and resistance levels.
It works best after a sustained uptrend and within clearly trending markets. When applied correctly and with confirmation, it can help you time exits, manage risk, and identify high-probability short setups.
FAQs
What does the Dark Cloud Cover pattern indicate in trading?
The Dark Cloud Cover pattern signals a potential bearish reversal after an uptrend. It shows a shift in control from purchasers to sellers, as a bearish candle opens above the previous bullish close and then closes below its midpoint.
Is the Dark Cloud Cover pattern reliable for intraday trading?
Yes, the dark cloud cover candlestick pattern can be used in intraday trading, especially on 1-hour or 4-hour charts. However, it becomes more reliable when combined with volume confirmation and indicators like RSI or moving averages.
How to confirm a Dark Cloud Cover candlestick signal?
You can confirm a dark cloud cover signal by:
- Waiting for the next candle to close lower.
- Checking if the pattern formed near a resistance level.
- Using indicators like RSI (showing overbought) or MACD (bearish crossover).
Can this pattern appear in sideways or range-bound markets?
While it can appear in sideways markets, the dark cloud cover pattern is less reliable in such conditions. It works best after a clear uptrend, where momentum is likely to shift.
What indicators work best with the Dark Cloud Cover pattern?
The most effective indicators to use with the dark cloud cover candle pattern include:
- RSI for spotting overbought conditions.
- MACD for trend confirmation.
- Moving averages for trend direction.
- Volume analysis to validate the strength of selling pressure.
Disclaimer
The information provided in this article is for educational and informational purposes only. It should not be considered as financial or investment advice. Investing in stocks involves risk, and it is important to conduct your research and consult with a qualified financial advisor before making any investment decisions. The author and publisher are not responsible for any financial losses or gains that may result from the use of this information.