Quick Summary
- Stochastic Oscillator is a momentum indicator that compares the current closing price to its recent price range, helping traders identify overbought or oversold conditions.
- It operates with two key lines: %K (the fast line) and %D (the signal line), and is used to spot market reversals or confirm momentum.
- Overbought is indicated by readings above 80, while oversold is shown below 20, suggesting potential price reversals.
- The oscillator is more effective in sideways or range-bound markets; however, in trending markets, it may give false signals.
- Combine with other indicators like RSI, MACD, and volume for better confirmation and to avoid premature trades.
The stochastic oscillator is a momentum-based tool that shows how strong or weak market sentiment is by comparing the current closing price to its recent range. It doesn’t just reveal direction; it highlights the pace of that movement, helping traders spot when momentum is fading or about to reverse.
In this blog, we’ll cover what the stochastic indicator means, how it’s calculated, how to read it effectively, and how to use it in real trading setups for better timing and accuracy.
Stochastic Oscillator Definition
The stochastic oscillator measures where the current closing price sits relative to its recent high-low range. It helps traders understand whether an asset’s momentum is strong, weakening, or about to reverse.
It’s called a momentum indicator because it reflects the speed and direction of price movement, showing how quickly buyers or sellers are driving the market.
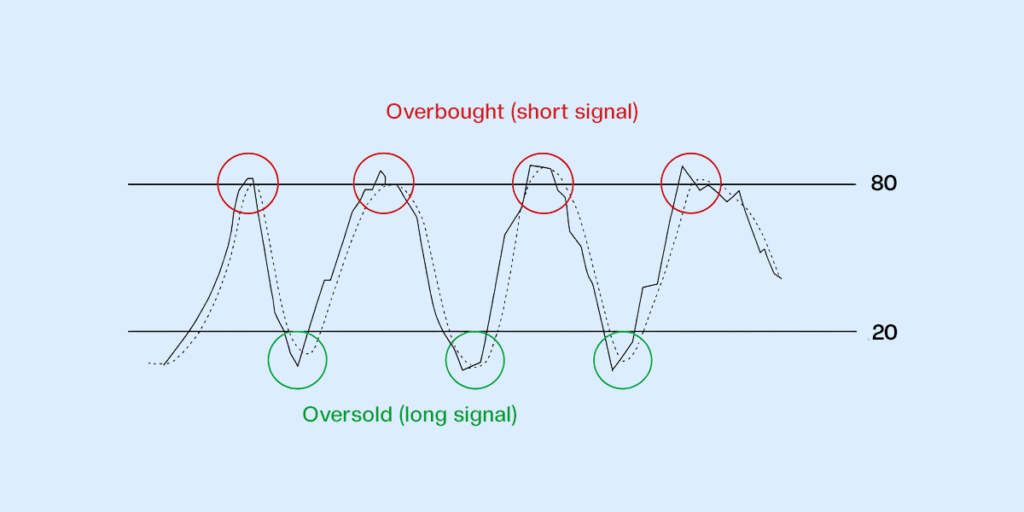
Traders use the stochastic indicator to identify overbought and oversold conditions:
- When readings are above 80, the asset is considered overbought and may face selling pressure.
- When readings are below 20, the asset is oversold, suggesting a possible rebound.
The Stochastic Formula Explained
The stochastic formula is:
%k = (Current Close – Lowest Price)/(Highest Price – Lowest Price) x 100
%D = 3-day SMA of %K
- %K (Fast Line): Shows the current price’s position within the recent range.
- %D (Signal Line): A 3-period moving average of %K — it smooths short-term noise and acts as a confirmation signal.
For example, if the current close is 90, the lowest low over the last 14 periods is 70, and the highest high is 100:
%k = (90– 70)/(100– 70) x 100 = 66.7
This means the price is near the upper-middle of its recent range — momentum is leaning bullish but not yet overbought.
How to Read the Stochastic Indicator
Knowing how to read the stochastic oscillator helps traders interpret momentum changes and plan trades with precision.
- Range (0–100): The oscillator moves between 0 and 100, representing the relative position of the closing price in the recent range.
- A closer to 100 indicates stronger buying momentum.
- A closer value to 0 indicates stronger selling pressure.
- Overbought and Oversold Zones:
- Above 80: Market may be overbought, potential for correction.
- Below 20: Market may be oversold, potential for a rebound.
These zones signal where the price might pause or reverse.
- Crossovers of %K and %D Lines:
- When %K crosses above %D from below 20 → bullish signal.
- When %K crosses below %D from above 80 → bearish signal.
The crossover points are where traders look for entry or exit opportunities.
How to Use Stochastic Indicator in Trading
Here are some steps to help you understand how to use the stochastic indicator:
- Spotting Trend Reversals:
- When the stochastic oscillator moves below 20 and then crosses upward, it shows a potential bullish reversal.
- When it moves above 80 and turns downward, it shows at a bearish reversal.
- Confirming Market Direction:
- In an uptrend, stochastic often stays above 50, confirming bullish strength.
- In a downtrend, it remains below 50, showing bearish momentum.
- Combining with Support and Resistance:
- When the stochastic turns upward from oversold levels near a support zone, it strengthens a buy setup.
- Likewise, a downward turn from overbought levels near resistance confirms the presence of selling pressure.
- Using with Other Indicators (RSI, MACD) for Accuracy:
- RSI: Used to double-check overbought/oversold signals.
- MACD: Combine to confirm trend direction — if both align, the signal is stronger.
- Volume or Moving Averages: Add extra confirmation to clean up entries.
These techniques can be applied across various asset classes, including global equities. Investors who invest in US stocks from India often combine technical indicators like the stochastic oscillator with broader market analysis to improve entry and exit decisions.
Types of Stochastic Oscillator
There are three versions of the stochastic oscillator, each offering a different balance between speed and smoothness. Understanding their differences helps traders choose the right one for their trading style.
| Type | Calculation Style | Speed & Sensitivity | When to Use |
| Fast Stochastic | Uses raw %K and %D values directly | Very fast and reactive | When you need immediate, short-term signals |
| Slow Stochastic | Smooths the %K line using a 3-period average | Slower, filters out noise | When you want fewer but more reliable signals |
| Full Stochastic | Customizable smoothing on %K and %D | Adjustable responsiveness | When you want control over speed and sensitivity |
Stochastic Oscillator vs Other Indicators
The stochastic oscillator is often compared with momentum tools like RSI and MACD, as all three help traders gauge market strength and turning points. While they share similarities, each indicator excels in different conditions. Here’s how they compare:
| Comparison | Stochastic Oscillator | RSI (Relative Strength Index) | MACD (Moving Average Convergence Divergence) |
| Main Focus | Measures price position within a recent range | Measures the strength of price momentum | Tracks momentum and trend direction |
| Best Market Type | Range-bound or choppy markets | Trending markets | Trending markets |
| Signal Type | Overbought/oversold reversals | Momentum strength and divergence | Trend continuation and crossover |
| Reactivity | Very responsive, generates frequent signals | Smoother, slower to react | Lagging but more reliable in trends |
| Typical Use | Short-term reversals, entry timing | Identifying trend strength | Confirming long-term trend shifts |
| When It’s More Effective | Works best in sideways markets or during short pullbacks | Best in strong trends | Best for spotting sustained momentum changes |
Limitations of the Stochastic Indicator
While the stochastic indicator is valuable for timing entries and spotting reversals, it is highly sensitive to price changes and can be misleading without proper confirmation.
- False signals in trending markets: During strong uptrends or downtrends, the stochastic can stay overbought or oversold for long periods, giving premature reversal signals.
- Less effective during high volatility: Sudden price spikes can trigger quick reversals on the oscillator, creating noise and confusion.
- Requires confirmation tools: Always pair stochastic signals with other indicators—MACD, RSI, or moving averages—to confirm trend strength before acting.
FAQs
What is a stochastic oscillator used for in trading?
The stochastic oscillator helps assess overbought and oversold levels by comparing a security’s closing price to its recent range. Readings above 80 suggest overbought; below 20 suggest oversold. It’s most effective in sideways markets for spotting reversals.
What is the formula of the stochastic oscillator?
The stochastic formula is:
%k = (Current Close – Lowest Price)/(Highest Price – Lowest Price) x 100
Where:
- Current Close = Latest closing price
- Lowest Low = Lowest price in the lookback period (usually 14 periods)
- Highest High = Highest price in the same period
How accurate is the stochastic indicator?
The accuracy of the stochastic oscillator depends on market conditions.
- It performs well in sideways or consolidating markets, where price frequently reverses near overbought/oversold zones.
- In strong trending markets, it may give false signals unless combined with other indicators like MACD or moving averages.
What is the difference between RSI and the stochastic oscillator?
RSI measures momentum strength, while the stochastic oscillator measures price position within a range. Also, RSI suits trending markets; stochastic works better in sideways ones.
Which stochastic setting is best for day trading?
For day trading, traders often use a fast stochastic (5, 3, 3) setting to capture quick intraday moves. For smoother, more reliable signals, some prefer the slow stochastic (14, 3, 3) — it filters out minor fluctuations and reduces noise.
Disclaimer
The information provided in this article is for educational and informational purposes only. It should not be considered as financial or investment advice. Investing in stocks involves risk, and it is important to conduct your research and consult with a qualified financial advisor before making any investment decisions. The author and publisher are not responsible for any financial losses or gains that may result from the use of this information.