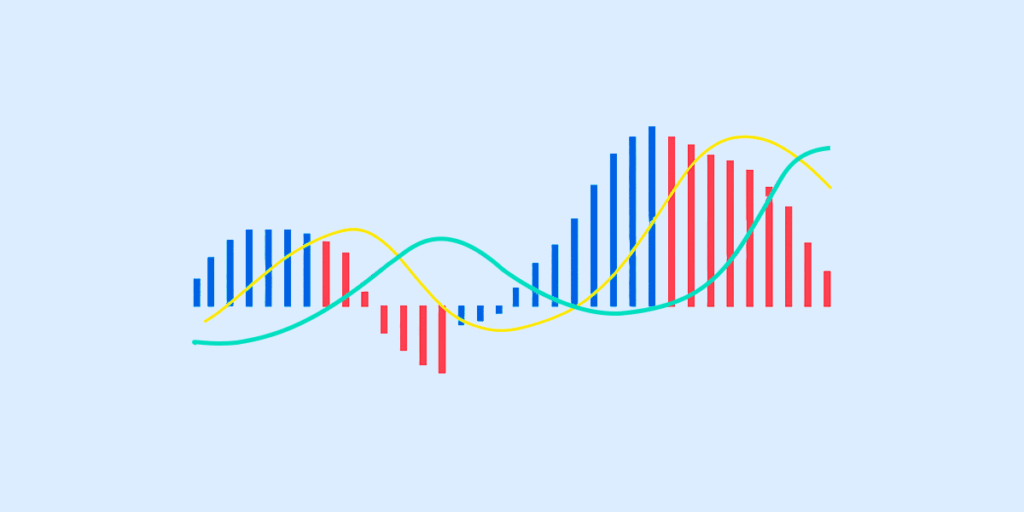
In trading, technical indicators are essential tools for making informed buy and sell decisions. They help traders cut through market noise, spot trends and plan entry and exit points with greater precision.
Among these, one of the most popular and easy-to-use indicators is the moving average. It smooths out price data over a specific period which helps you clearly see the underlying trend instead of reacting to short-term fluctuations.
Moving averages are widely used in trend analysis—whether you’re identifying the start of a new trend, confirming its strength, or spotting potential reversals. Their versatility makes them suitable for both beginners, who need a simple and visual tool, and experienced traders, who may combine them with other indicators for advanced strategies.
Continue reading to know more!
What is a Moving Average?
In the stock market, spotting the real trend before most traders do is the difference between catching the wave and missing it entirely. That’s where moving averages come in—as a decision-making framework used by traders worldwide.
From short-term scalpers to long-term investors, moving averages act as a common language for interpreting price action. They help you:
- Confirm if a trend is truly in motion or just noise.
- Signal potential reversals when trends lose strength.
- Support timing decisions when paired with other indicators.
Additionally, because they can be customised (SMA, EMA, WMA, and more), moving averages adapt to different trading styles, timeframes, and risk appetites, making them one of the most versatile tools in technical analysis.
How is Moving Average Calculated?
The Simple Moving Average (SMA) is one of the most simple and straightforward types of moving average. You can calculate it by taking the sum of the closing prices over a set number of periods and then dividing it by the number of periods. The formula basically is:
SMA = (Sum of closing prices over N periods) ÷ N
Here,
N = the number of periods you want to average, such as 5 days, 10 days, or 50 days.
For example, if a stock closes at ₹100, ₹102, ₹101, ₹105, and ₹107 over five days:
SMA = (100 + 102 + 101 + 105 + 107) ÷ 5
SMA = 515 ÷ 5 = ₹103
The 10-Day SMA works the same way but averages over 10 days which makes it smoother and less sensitive to short-term price changes.
The Exponential Moving Average (EMA) is kind of similar but it gives more weight to recent prices, making it a little more responsive to new market data. This is particularly very useful for short-term traders who need faster signals compared to the slower, steadier SMA.
Types of Moving Averages in Trading
In trading, moving averages come in different forms—each suited to specific market conditions and trading styles:
- Simple Moving Average (SMA): The Simple Moving Average assesses the average price of a security over a set number of periods. It pays equal weight to all data points, making it smooth and stable. It is best for long-term analysis and spotting the overall trend direction.
- Exponential Moving Average (EMA): This type of moving average pays more weight to recent prices and makes it more responsive to new market data. It is best for short-term trades and volatile market conditions where quick reaction is key.
- Other Moving Averages:
- Weighted Moving Average (WMA): Gives extra weightage to recent prices but in a linear fashion.
- Hull Moving Average (HMA): Reduces lag while maintaining smoothness, often used for faster trend detection.
- Smoothed Moving Average: Similar to SMA but uses a longer period to reduce noise.
How is Moving Average Used in Trading?
The moving average is one of the most widely used tools in technical analysis. It helps traders recognise trends, reversals, and potential entry/exit points. Here’s how you can apply it in moving average trading:
- Moving average crossover strategies: Traders often use two different timeframes, for example, the 50-day and 200-day moving averages. A crossover of the shorter MA above the longer MA signals a potential uptrend (Golden Cross) and the opposite shows a potential downtrend (Death Cross).
- Identifying trend direction and reversals: If the price consistently stays above its moving average, it suggests an uptrend; if it remains below, it indicates a downtrend. This helps traders align positions with the market direction.
- Combining with other indicators: The moving average indicator is usually paired with additional tools like RSI or MACD to confirm signals, reduce false breakouts and improve decision-making in moving average trading.
Limitations of Moving Averages
While moving averages are a popular tool in trading, they come with certain limitations that traders should be aware of:
- Lagging indicator: The moving average indicator is based on past price data, so it reacts after the price movement has already occurred. This delay can cause late entries or exits in moving average trading.
- Not ideal in sideways or choppy markets: In range-bound markets, moving averages can generate frequent false signals, leading to potential losses.
- Requires confirmation from other indicators: Relying solely on moving average trading is risky. Combining it with tools like RSI, MACD, or volume analysis improves reliability and reduces false signals.
FAQs
What is a moving average in trading?
The moving average in trading is a technical analysis tool that smooths out price data by calculating the average price of a security over a set period of time. It helps traders identify the overall market trend by filtering out short-term price fluctuations. The moving average indicator is very commonly used in moving average trading strategies to spot trend directions and potential entry or exit points.
What are the different types of moving averages?
The main types of moving averages are:
- Simple Moving Average (SMA): Calculates the arithmetic mean of prices over a chosen period.
- Exponential Moving Average (EMA): Gives more weight to recent prices and makes it more responsive to current market movements.
- Weighted Moving Average (WMA): Assigns different weights to each data point, focusing on the most recent prices.
How does the moving average indicator work?
The moving average indicator works by continuously updating the average price as each new price data point becomes available. In moving average trading, this line helps traders visualise whether the price is trending upward, downward, or sideways. When the price climbs above the moving average, it may signal a bullish trend; when it moves below, it may indicate a bearish trend.
Which moving average is best for intraday trading?
For intraday trading, many traders prefer the Exponential Moving Average (EMA) because it reacts faster to recent price changes than the SMA. Common EMA settings for intraday moving average trading include 9-day, 20-day, or 50-day EMAs, depending on the strategy and time frame used.
Can I use a moving average alone for trading decisions?
While you can use the moving average indicator alone to get a general sense of trend direction, relying solely on it for moving average trading decisions can be risky. It’s best to combine it with other indicators like RSI, MACD or volume analysis to confirm signals and reduce false breakouts.
Disclaimer
The information provided in this article is for educational and informational purposes only. It should not be considered as financial or investment advice. Investing in stocks involves risk, and it is important to conduct your research and consult with a qualified financial advisor before making any investment decisions. The author and publisher are not responsible for any financial losses or gains that may result from the use of this information.

