
The shooting star candlestick pattern is a widely used signal in technical analysis that helps traders identify potential bearish reversals after an uptrend. It is part of the family of single candlestick patterns and is closely watched because it highlights a sudden rejection of higher prices by sellers.
A shooting star typically forms when the market opens, moves significantly higher during the session, but then closes near its opening price. The result is a candlestick with a small body near the low of the day and a long upper shadow, showing that buyers pushed prices up but failed to sustain control. Read along to know more!
What is Shooting Star Candle Pattern
Now that we have taken a brief look at what candlestick patterns are, let’s see what a shooting star candlestick pattern is. A shooting star is a single-candle pattern where the price opens, rallies strongly during the session, but closes near the opening level. This shows that sellers stepped in and rejected higher prices.
The candle has a small real body near the day’s low, a long upper shadow (at least twice the body), and little or no lower shadow. This structure reflects failed bullish momentum.
Key Characteristics of a Shooting Star Candlestick
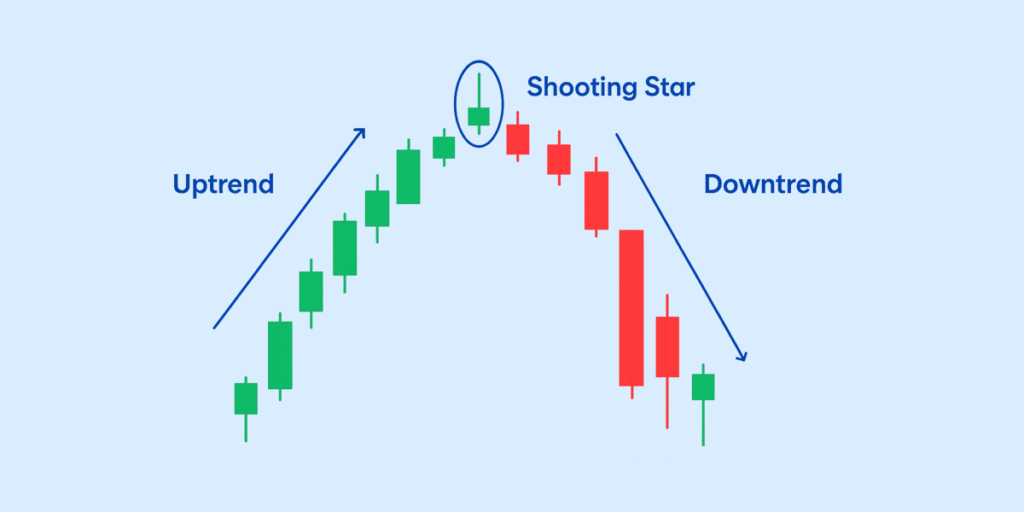
The shooting star candle stick pattern is a bearish reversal signal that forms after an uptrend. Traders use its distinct shape to anticipate a potential trend shift. The key characteristics include:
- Small real body near the day’s low: Showing that sellers managed to push prices back down after an early rally.
- Long upper shadow (at least twice the body): Indicates strong selling pressure despite buyers’ attempt to push the price higher.
- Little to no lower shadow: Reinforces that sellers dominated the session’s close.
- Appears after an uptrend: Its reliability depends on forming after a sustained rise in price.
How Shooting Star Trading Works
The shooting star candlestick pattern is one of the most popular bearish reversal signals in technical analysis. Traders must understand the psychology behind the candle and the confirmations that strengthen its reliability to trade it effectively.
Market Psychology Behind the Shooting Star
A shooting star forms after a price rally, when buyers push the stock higher during the session. However, strong selling pressure pulls the price back down, leaving a long upper shadow and a small body near the low.
- This shift shows that buyers are losing control.
- Sellers are stepping in with strength.
- The market may be preparing for a reversal.
What Traders Look for After Spotting a Shooting Star
Spotting the pattern is only the first step. Traders usually check:
- Location: Appears after an uptrend, preferably near resistance zones.
- Volume: Higher volume adds credibility to the signal.
- Trend Strength: The sharper the rally before the shooting star, the stronger the reversal potential.
Confirmation Signals to Strengthen the Trade
Because a shooting star can produce false signals, traders often wait for confirmation before entering short positions. Some common confirmations include:
- Next candle closing lower than the shooting star’s body.
- Increased trading volume during or after the shooting star.
- Resistance rejection: Price failing to move above a known resistance line.
- Indicators check: Using RSI, MACD, or moving averages to confirm bearish momentum.
How to Trade Using the Shooting Star Chart Pattern
Spotting a shooting star candle can signal a potential trend reversal, but the real edge comes from knowing how to trade it correctly. Here’s a step-by-step approach to using the shooting star pattern effectively.
1. Identify the Candle
Begin by identifying a valid shooting star candle. It typically features a small real body near the low of the candle, a long upper wick, and little to no lower shadow. This pattern is most reliable when it appears at the top of an uptrend.
2. Look for Confirmation
Confirmation is essential before taking a trade. Common confirmation signals include higher-than-average trading volume, a bearish candle forming after the shooting star, or price breaking below the low of the shooting star candle. Traders may also use technical indicators such as RSI or moving averages to strengthen confirmation.
3. Enter the Trade
After confirmation, traders can initiate a position. Aggressive traders may enter immediately after the shooting star forms, while conservative traders typically wait for a bearish follow-through candle or a decisive break below the shooting star’s low.
4. Plan the Exit
Risk management is critical. A stop-loss is usually placed above the high of the shooting star candle to limit downside risk. Profit targets can be set near key support levels, or traders can use a trailing stop-loss to capture extended moves. Investors learning how to invest in US stocks from India can apply the same risk management principles while analysing US-listed companies.
Types of Shooting Star Candlesticks
Not all shooting stars look the same, but both variations carry a bearish implication.
- Bearish Shooting Star: Most common type, with a small red (bearish) real body. Signals that buyers lost control and sellers may be ready to drive prices lower.
- Green Shooting Star Candlestick: Less common, with a small green (bullish) body. Despite the green close, the long upper shadow shows rejection of higher prices, making it a bearish signal when confirmed by the next candles.
Shooting Star vs Other Candlestick Patterns
The shooting star candlestick pattern is often confused with other reversal signals, so it’s important to know the differences:
| Pattern | Candle Structure | Signal Type | Key Difference from Shooting Star |
| Shooting Star | Small body near the low, long upper shadow | Bearish signal | Appears at the top of an uptrend, warns of reversal |
| Evening Star | Three-candle formation (bullish → small candle → bearish) | Bearish signal | Stronger reversal confirmation than a single shooting star |
| Hammer | Small body near the high, long lower shadow | Bullish signal | Opposite of a shooting star, forms at the bottom of a downtrend |
| Inverted Hammer | Small body near the low, long upper shadow | Bullish setup | Looks similar to a shooting star but occurs at the bottom, not the top |
When Not to Confuse the Pattern
Traders sometimes mistake any candle with a long upper wick as a shooting star. However, context matters. A valid shooting star must appear after a sustained uptrend, and the body should be small, closing near the day’s low.
Limitations of the Shooting Star Pattern
While the shooting star candle pattern is widely used, it has certain limitations:
- False Signals in Sideways or Choppy Markets: If the market is range-bound, a shooting star may not carry much weight, as price action lacks a clear trend.
- Need for Confirmation Indicators: Relying only on this pattern can be risky. Confirmation through tools like RSI, MACD, or moving averages helps validate the bearish setup.
- Not Reliable in Strong Bullish Momentum: In powerful uptrends, even a well-formed bearish shooting star may fail, as market sentiment can override the reversal signal.
Practical Example of Shooting Star in Trading
Let’s say Stock XYZ has been in a steady uptrend, moving from ₹950 to ₹1,100 over a few sessions. On a particular day, the price opens at ₹1,095, rallies to ₹1,130, but then faces heavy selling pressure. By the close, it settles at ₹1,100, very close to its opening level.
The candlestick formed has:
- A small real body near the session low (₹1,095–₹1,100).
- A long upper shadow stretching up to ₹1,130, more than twice the size of the body.
- Little to no lower shadow.
This is a classic shooting star candlestick pattern, signalling that although buyers tried to push prices higher, sellers regained control.
Conclusion
The shooting star pattern is a simple yet beneficial tool for spotting weakening bullish sentiment. While it should not be relied on in isolation, when confirmed by volume or other indicators, it becomes a valuable part of a trader’s decision-making process.
FAQs on Shooting Star Candlesticks
The shooting star candlestick pattern shows a potential bearish reversal after an uptrend. It signals that buyers pushed prices higher during the session, but sellers regained control, driving the close near the low of the day.
A shooting star candle pattern is typically bearish, suggesting weakening buying momentum and possible trend reversal to the downside.
To confirm a shooting star trading setup, traders look for a bearish candle that follows the shooting star, ideally with strong volume. This confirmation strengthens the likelihood of a reversal.
The difference between a shooting star pattern and an inverted hammer lies in their placement. While both look similar, the shooting star forms at the top of an uptrend (bearish signal), whereas the inverted hammer appears at the bottom of a downtrend (potential bullish reversal).
Yes, even a green shooting star candlestick can be bearish. The key factor is the long upper shadow and small body near the low, which shows selling pressure irrespective of whether the body is green or red.
Disclaimer
The information provided in this article is for educational and informational purposes only. It should not be considered as financial or investment advice. Investing in stocks involves risk, and it is important to conduct your research and consult with a qualified financial advisor before making any investment decisions. The author and publisher are not responsible for any financial losses or gains that may result from the use of this information.


