The descending triangle pattern is a chart formation in technical analysis that traders closely watch to anticipate potential market moves. It forms when a stock, index, or asset creates a flat support line at the bottom while also recording lower highs over time which leads to a contracting price structure.
This pattern is often considered a bearish continuation signal, but in some cases, it may also result in a bullish breakout. Traders use the descending triangle as it highlights the tug-of-war between buyers and sellers, with sellers gradually pushing prices lower.
In this blog, we’ll cover the characteristics, identification process, trading strategies, and limitations of the descending triangle pattern.
Understanding the Descending Triangle Chart Pattern
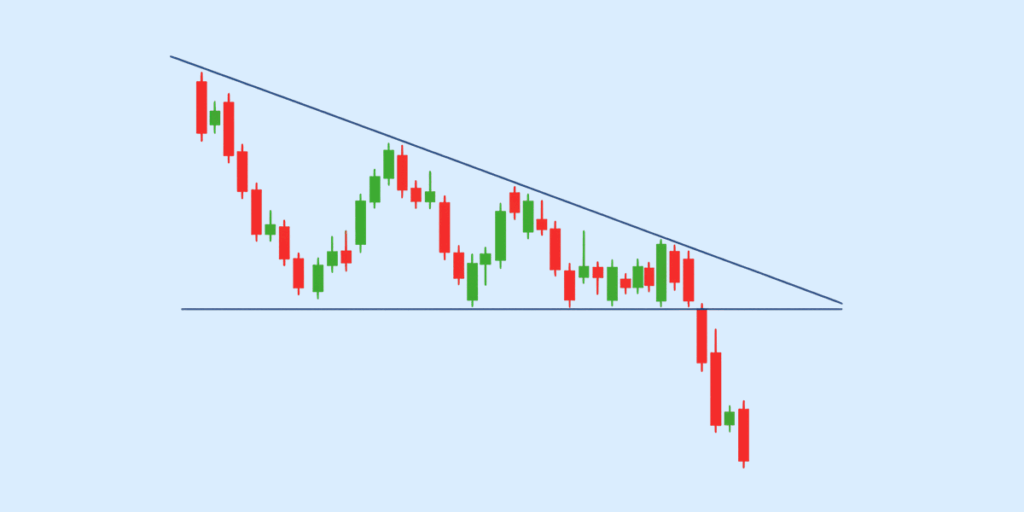
A descending triangle is a bearish chart pattern that forms when the price creates a flat support level on the bottom while lower highs press against it from above.
On a candlestick or line chart, the base of the triangle is drawn along a horizontal support line, while the top is formed by connecting a series of lower highs with a downward-sloping resistance line. As trading progresses, the price consolidates within this narrowing structure.
Market Psychology Behind It
The descending triangle reflects sellers gradually overpowering buyers. The flat support shows buyers are defending a level, but each rally attempt weakens, creating lower highs. Eventually, if support gives way on strong volume, it often confirms bearish momentum.
Key Characteristics of a Descending Triangle
The descending triangle pattern is one of the most commonly studied continuation patterns in technical analysis. Traders look for the following characteristics to confirm its presence on a chart:
- Flat Horizontal Support Line: The base of the triangle is formed by a strong support level, where price repeatedly tests but fails to break higher.
- Lower Highs Forming a Descending Resistance Trendline: Sellers gradually gain control, pushing the highs lower each time. Connecting these lower highs creates the downward-sloping resistance.
- Price Consolidation Before a Breakout: As the triangle narrows, the price compresses into a tight range, signalling that a significant move is likely ahead.
- Best in a Downtrend, But Not Exclusive: The descending triangle is most reliable as a bearish continuation pattern, but it can occasionally appear in an uptrend, leading to bullish breakouts.
How to Identify a Descending Triangle in Trading
The descending triangle pattern is easy to recognise once you know what to look for. It combines a horizontal support level with a downward-sloping resistance line. Here’s how traders usually identify it:
- Draw the Support Line: Look for a horizontal level where the price touches multiple times without breaking down; this will act as the base of the triangle.
- Draw the Resistance Line: Connect the series of lower highs that converge towards the support. This creates the descending slope.
- Check for Convergence: The two lines (support and resistance) should converge, forming a triangle shape that narrows over time.
- Watch the Breakout: The pattern is confirmed when the price breaks below support (bearish case) or occasionally above resistance (bullish breakout).
Ideal Timeframes
- Daily and Weekly Charts: More reliable for swing and positional trades.
- Intraday Charts (15-min, 1-hour): Often used by day traders but it requires stronger volume confirmation due to higher noise.
Confirmation Signals Before Breakout
- Volume: Rising volume on the breakout side validates the move.
- Candlestick Confirmation: A strong bearish candle below support, or a bullish candle above resistance, confirms the breakout.
- Indicators: Tools like RSI or MACD can provide extra confirmation of momentum.
Tip: A descending triangle is most reliable when it forms after a strong downtrend, signalling continuation.
Descending Triangle: Bullish or Bearish?
The descending triangle pattern is most commonly viewed as a bearish continuation signal in technical analysis. It forms when prices create lower highs against a horizontal support level, suggesting that sellers are steadily overpowering buyers. Once the support breaks, the pattern usually leads to further downside movement.
Why It’s Considered Bearish
- Sellers consistently push the price down with lower highs.
- Support is repeatedly tested, showing weakening demand.
- Breakouts often occur to the downside which is supported by high trading volume.
When It Can Be Bullish
While the descending triangle is predominantly bearish, there are instances where it breaks upward. This happens when buying pressure builds despite the lower highs, leading to a breakout above the descending resistance. Such bullish breakouts are less common and usually need volume confirmation before traders act on them.
Descending Triangle vs Other Triangle Patterns
The descending triangle pattern is one of several common triangle formations in technical analysis. While all triangle patterns represent a phase of consolidation before a breakout, their structure and trading implications differ. Let’s compare:
Descending Triangle vs Ascending Triangle
- Descending Triangle: Features a flat support line with a descending resistance line. Generally, signals bearish continuation, as sellers push prices lower.
- Ascending Triangle: Has a flat resistance line with rising support. More often considered a bullish continuation signal which shows that buyers are gradually gaining control.
Descending Triangle vs Symmetrical Triangle
- Descending Triangle: Bias leans bearish, since each rally is capped at lower highs while support is repeatedly tested.
- Symmetrical Triangle: Both trendlines slope toward each other. It’s considered neutral, with the breakout direction depending on whether bulls or bears dominate.
Descending Triangle vs Wedge Patterns
- Descending Triangle: Typically horizontal support with falling highs; breakout is usually downward.
- Falling Wedge: Both trendlines slope downward, but it’s often seen as a bullish reversal pattern because the selling pressure weakens over time.
How to Trade the Descending Triangle Pattern
The descending triangle pattern is most often seen as a bearish continuation signal, but it needs careful execution. Here’s how traders typically approach it:
1. Entry Points After Breakout
The ideal entry is after the price breaks below the horizontal support line of the descending triangle chart pattern. Conservative traders wait for a candle close below support to confirm the breakdown, while aggressive traders may enter as soon as the breakout occurs.
2. Setting Stop-Loss Levels
A stop-loss is usually placed just above the descending trendline or slightly above recent swing highs. This protects against false breakouts where the price quickly reverses back into the triangle.
3. Calculating Target Price
The potential price target is often estimated by measuring the the triangle’s height at its widest part (the distance between the initial high and support). This height is then deducted from the breakout point to project a likely downside move.
4. Using Confirmation Tools
Relying only on the triangle can be risky. Traders often confirm signals with momentum indicators like RSI, trend tools like moving averages, or volume spikes. For example, a breakdown accompanied by high volume and RSI moving below 50 is seen as a stronger confirmation.
Limitations of the Descending Pattern
While the descending triangle pattern is a widely used bearish continuation setup, it does come with certain limitations that traders need to keep in mind:
- False breakouts in sideways markets: A descending pattern can often give misleading signals in range-bound or sideways conditions. Prices may briefly break support or resistance but fail to sustain momentum.
- Not always reliable without volume confirmation: Volume plays an important role in validating the descending triangle chart pattern. A breakdown with weak or declining volume may indicate a false move rather than a true bearish continuation.
- Better when combined with other indicators: Relying solely on the descending triangle can be risky. Traders usually confirm signals using other tools (like RSI and MACD) or moving averages to boost accuracy.
Practical Example of Descending Triangle in Stock Charts
Let’s say a stock is trading at ₹500. Over the next few weeks, the price continuously bounces off a strong support level at ₹480. But, each rebound is weaker than the last.
Sellers push the highs down (from ₹495 to ₹490 and then to ₹485), creating a descending resistance line. At this stage, the chart forms the classic descending triangle:
- Support Line: Flat at ₹480, showing buyers stepping in at the same level.
- Lower Highs: A downward sloping trendline connecting ₹495 → ₹490 → ₹485.
- Volume: Typically decreases during the consolidation phase.
- Breakout: When sellers finally overpower buyers, the price drops below ₹480 on high volume, confirming the bearish breakout.
This is how traders spot the descending triangle in practice. The breakout often signals an opportunity for short positions, with the target price calculated by subtracting the triangle’s height (₹20) from the breakdown level (₹480 → ₹460).
Conclusion
The descending triangle is a simple yet rewarding pattern that helps traders understand the balance between buyers and sellers. While it often signals downside continuation, traders need to confirm it through volume and other indicators before acting on it. Once you master this patter, you can sharpen your technical analysis and improve trade timing. If you also want to diversify globally, you can learn how to invest in US stocks from India and expand beyond domestic markets.
FAQs
What is the descending triangle pattern in trading?
The descending triangle pattern is a bearish continuation formation that appears during a downtrend. It is formed by a horizontal support line and a descending resistance line, showing that sellers are consistently pushing prices lower while buyers struggle to hold a level.
Can a descending triangle pattern be bullish?
While the descending triangle chart pattern is typically bearish, in rare cases, it can act as a reversal if the price breaks above the descending trendline with strong volume. This bullish breakout is less common but possible.
How accurate is the descending triangle chart pattern?
The accuracy of a descending pattern depends on factors like volume confirmation, timeframe, and overall market trend. In technical analysis, descending triangles are generally reliable bearish indicators, but traders often combine them with other tools before acting.
What is the difference between a descending and an ascending triangle?
A descending triangle has a flat support and a downward-sloping resistance, usually signalling bearish momentum. In contrast, an ascending triangle has flat resistance and upward-sloping support, often viewed as a bullish continuation triangle pattern.
Is a descending wedge the same as a descending triangle?
No, a descending wedge and a descending triangle are different. The wedge narrows with both support and resistance sloping downwards which often signals a bullish reversal. The descending triangle pattern, however, generally indicates bearish continuation.
Disclaimer
The information provided in this article is for educational and informational purposes only. It should not be considered as financial or investment advice. Investing in stocks involves risk, and it is important to conduct your research and consult with a qualified financial advisor before making any investment decisions. The author and publisher are not responsible for any financial losses or gains that may result from the use of this information.