A Pin Bar candlestick pattern is a clear sign of market rejection—a single candle that tells you where buyers or sellers lost control. Its long wick and small body make it one of the most reliable tools for spotting reversals before they happen.
In this blog, we’ll explore what a Pin Bar means, how to identify it, its types, psychology, trading strategies, and how to use it effectively in real market situations.
Introduction to Pin Bar Candlestick
The Pin Bar reflects a sharp shift in market sentiment, with the price moving strongly in one direction before reversing, which leaves a long shadow behind. This makes it one of the most recognised and reliable reversal signals in price action trading.
Traders use Pin Bars to spot entry and exit points near key support or resistance zones. They provide early clues to potential reversals, helping traders anticipate market turns before larger moves.
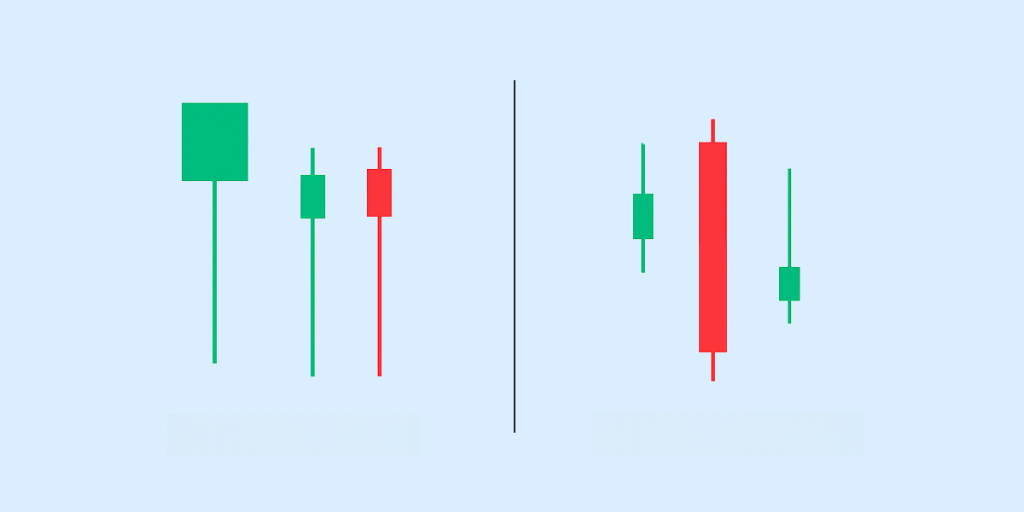
Understanding the Components of a Pin Bar Candle
A Pin Bar candlestick has a distinct structure that reveals the story of price rejection and market indecision. Recognising its components helps traders interpret what’s happening behind the chart.
- Body:
- The small real body shows a brief balance between buyers and sellers before one side regains control.
- It represents indecision, signalling that the market tested a level but couldn’t sustain movement in that direction.
- Wicks (Shadows):
- The wick, or shadow, is the defining feature of a Pin Bar and indicates rejection.
- Upper Wick: Shows rejection of higher prices—buyers tried to push up, but sellers took over.
- Lower Wick: Shows rejection of lower prices—sellers pushed down, but buyers stepped in with strength.
Types of Pin Bar Candlestick Patterns
Pin Bars can appear in both bullish and bearish market conditions. The direction of the wick and the candle’s position within the trend determine the type.
- Bullish Pin Bar:
- Appears after a downtrend.
- Has a long lower wick and a small body near the top of the candle.
- Indicates strong buying pressure and rejection of lower prices—a possible upward reversal.
- Bearish Pin Bar:
- Forms after an uptrend.
- Has a long upper wick and a small body near the bottom of the candle.
- Shows strong selling pressure and rejection of higher prices—a potential shift toward the downside.
Psychology Behind the Pin Bar Formation
Every Pin Bar candlestick tells a story about market sentiment; it’s the visual proof of rejection at a certain price level. The long wick and small body reveal a sudden shift in control between buyers and sellers.
Market Sentiment Reflected in the Formation
A Bullish Pin Bar forms when sellers initially push prices down, but buyers step in strongly, forcing a close near the candle’s high. This signals rejection of lower prices and potential upward reversal.
A Bearish Pin Bar occurs when buyers drive prices up but are overpowered by sellers, leading to a close near the candle’s low—a warning of possible downward reversal.
Implications of Rejection at Specific Price Levels
The long wick represents price rejection, showing where the market tried to go but couldn’t stay. When a Pin Bar appears near support or resistance, it strengthens the reversal signal.
Multiple rejections at the same level often confirm that buyers or sellers are firmly defending a price zone.
How to Identify a Pin Bar Candlestick Pattern
Spotting a Pin Bar candlestick is simple, but recognising it in the right context is what makes it valuable.
Visual Characteristics to Look For
- A small real body located near one end of the candle (top or bottom).
- A long wick (also called a tail or shadow) that’s at least two to three times the length of the body.
- Minimal wick on the opposite end.
- Clear appearance of price rejection—the market moved sharply in one direction before reversing.
Importance of Context in Identification
- Pin Bars appearing near key support, resistance, or trendline levels carry more weight.
- Avoid trading Pin Bars in sideways or choppy markets, where signals can be unreliable.
- Confirm the setup with volume, trend direction, or confluence zones before you enter a trade.
Trading Strategies Using Pin Bar Candlestick Patterns
The Pin Bar candlestick pattern is among the most practical tools for recognising potential market reversals, and a clear strategy helps turn these signals into high-profit trades. These technical analysis principles are useful across different markets, whether you trade Indian equities or invest in US stocks from India, where identifying reversal patterns can help improve entry and exit decisions.
- Entry Points:
- Enter after the Pin Bar closes, confirming rejection of the price level.
- For a Bullish Pin Bar, consider entering near the next candle’s open, above the high of the Pin Bar.
- For a Bearish Pin Bar, look to enter below the low of the Pin Bar to confirm downside momentum.
- Stop-Loss Placement:
- Always place your stop-loss just beyond the tail (wick) of the Pin Bar.
- For bullish setups, stop below the candle’s low; for bearish setups, stop above the candle’s high.
- This helps protect against false breakouts while allowing the trade room to move.
- Risk-to-Reward Ratio Considerations:
- Aim for a minimum 1:2 risk-to-reward ratio—meaning your target should be at least twice your risk.
- Use nearby support/resistance levels or Fibonacci levels to define profit targets.
- Consistent position sizing and disciplined exits improve long-term profitability.
Limitations of the Pin Bar Candlestick Pattern
While Pin Bar patterns are effective, they’re not foolproof. Misreading context or relying on it alone can lead to losses.
- Potential for False Signals:
- In volatile or sideways markets, Pin Bars can form frequently but fail to indicate genuine reversals.
- Traders may enter prematurely if they don’t wait for candle confirmation or volume support.
- Importance of Confirmation from Other Indicators:
- Use tools like Moving Averages, RSI, or MACD to confirm momentum and direction.
- Align Pin Bar setups with broader trend structures, such as price channels or key support/resistance zones.
- Avoid trading against strong trends unless there’s clear reversal confirmation.
Frequently Asked Questions (FAQs)
What is a Pin Bar Candlestick?
A Pin Bar candlestick is a single-candlestick pattern that signals a potential market reversal. It has a small body and a long wick, showing rejection of a certain price level and a possible change in direction.
How can I identify a Bullish Pin Bar?
A Bullish Pin Bar appears after a downtrend and has a long lower wick with a small upper body. This indicates that sellers pushed the price down, but buyers stepped in and drove it back up, a sign of potential upward movement.
What does a Bearish Pin Bar indicate?
A Bearish Pin Bar forms after an uptrend and has a long upper wick with a small lower body. It shows that buyers tried to push prices higher but failed, as sellers regained control, signalling possible downward momentum.
Can Pin Bar patterns be used in all timeframes?
Yes. Pin Bar candlestick patterns can appear and work across all timeframes, from intraday charts to weekly or monthly ones. However, signals on higher timeframes (such as daily or weekly) are usually more reliable than those on shorter timeframes.
How reliable are Pin Bar Candlestick patterns in trading?
Pin Bar candles are considered reliable when confirmed by trend direction, support/resistance levels, or volume analysis. On their own, they provide valuable insight into price rejection, but combining them with other technical tools increases accuracy and reduces false signals.
Disclaimer
The information provided in this article is for educational and informational purposes only. It should not be considered as financial or investment advice. Investing in stocks involves risk, and it is important to conduct your research and consult with a qualified financial advisor before making any investment decisions. The author and publisher are not responsible for any financial losses or gains that may result from the use of this information.