
Price action trading has become one of the most followed approaches among active traders because it focuses on what truly drives markets—price itself. Instead of relying on multiple indicators or formulas, it studies how prices behave at key levels and during different phases of a trend.
This makes it a practical method for traders who want clarity in fast-moving markets. In this blog, we’ll look at how price action trading works in practice, why traders use it, and how it can improve decision-making across different timeframes.
What is Price Action?
Price action is the movement of a security’s price plotted over time. It is the most basic form of market data and forms the foundation of all technical analysis. Instead of relying on complex indicators, price action focuses on raw price movements shown through candlesticks, bars, or line charts.
Professional traders across markets (whether in forex, stocks, or commodities) use price action to identify trends, reversals, and trading opportunities. By studying patterns like breakouts, consolidations, or candlestick formations, traders can make decisions directly from the chart without overloading it with indicators.
How Does Price Action Trading Work?
Price action trading is about reacting to price changes as they happen, instead of predicting where the market will go in the long term. Traders study recent moves and use that information to decide whether to buy, sell, or stay out.
Some of the most common ways to analyse price action are through:
- Candlestick Charts: Each candlestick shows the open, high, low, and close for a period, helping traders spot momentum and sentiment. Patterns like engulfing candles, pin bars, or dojis are common signals used to enter or exit trades.
- Support and Resistance: These are key levels where prices have historically bounced or stalled. A breakout above resistance or a drop below support often acts as a trade trigger.
- Breakouts and Reversals: Price consolidations and trendlines are closely monitored. Traders look for signs of continuation or reversal to plan their next move.
The focus is on immediate market behaviour. Instead of relying on complex forecasts, traders base their decisions on how the market is behaving now. This makes price action trading especially useful for short-term and intraday strategies.
Common Price Action Chart Patterns
Price action trading relies heavily on chart patterns that reveal market psychology. These patterns help traders identify potential entries, exits, and trend continuations. Here are some of the most widely used:
1. Pin Bars
One of the simplest examples is the Pin Bar, a candle with a long wick and a small body. It shows price rejection. If you see a bullish pin bar near support, traders often take it as a sign that buyers stepped in and may push prices higher. A bearish pin bar near resistance suggests the opposite.
2. Inside Bars
In Inside Bars, the entire candle sits within the high and low of the previous one, showing short-term consolidation. Traders usually wait for a breakout from this range, which often sets the stage for the next move.
3. Engulfing Patterns
The Engulfing Pattern is more aggressive: a large candle completely covers the previous one, showing a sudden momentum shift. Bullish engulfing candles near support signal strong buying pressure, whereas bearish engulfing near resistance points to selling strength.
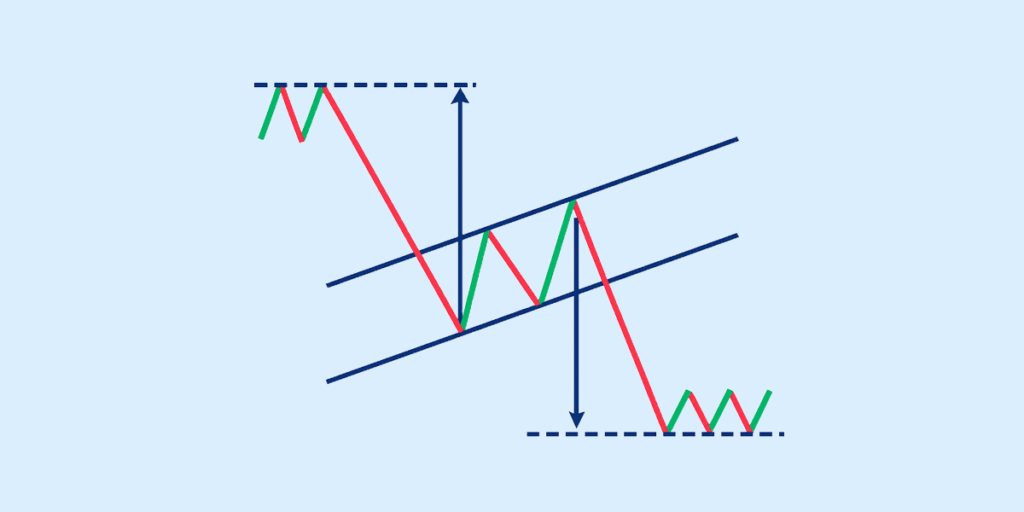
4. Flags and Triangles
For trend traders, patterns like Flags and Triangles are crucial. They represent pauses in a trend: prices consolidate briefly before deciding the next leg. Breakouts from these shapes often continue in the same direction as the prior trend.
These price action chart patterns don’t guarantee outcomes but give traders structured ways to interpret market moves. Combined with support/resistance and volume, they become powerful tools for decision-making.
Why Learn Price Action Trading?
Learning price action trading offers a lot of clear benefits for traders who want to simplify their approach without losing effectiveness.
1. Simplicity
Price action trading keeps charts clean. There’s no need for multiple indicators or complicated setups—just the raw price and candlesticks. This makes it easier to focus on what truly matters: how the market is moving.
2. Pure Analysis
Price action works directly with the price itself, instead of relying on lagging indicators. Every candlestick reflects real market sentiment which gives traders immediate insights without delay.
3. Better Risk Management and Timing
By studying support and resistance, breakouts, and candlestick patterns, traders can identify precise entry and exit levels. This helps in placing smarter stop-losses, improving timing, and managing risk more effectively.
How to Start Learning Price Action?
Getting into price action trading doesn’t require advanced tools, but it does take consistent practice and the right approach. Here’s a step-by-step way to begin:
1. Learn the Basics
Start with candlestick charts and volume analysis. Try to understand how each candle represents the market’s story (open, high, low, and close) and how volume confirms the strength of those moves.
2. Spot Chart Patterns
Once you’re comfortable with candlesticks, practice recognising key price action chart patterns such as pin bars, engulfing candles, inside bars, flags, and triangles. These will help you identify and assess potential setups for entries and exits.
3. Backtest and Use Demo Accounts
Don’t get straight into live trading. Begin by backtesting strategies on historical data to see how they would have performed. Follow this up with a demo account to build confidence without risking real money.
4. Learn from Reliable Sources
There’s plenty of material available to learn price action:
- Books written by experienced traders, such as ‘Trading Price Action Trends’ by Al Brooks and ‘Pring on Price Patterns’ by Martin Pring.
- Online courses dedicated to price action trading, such as ‘Price Action Trading Master Class’ on Udemy and Brooks Trading Course by Al Brooks.
- Trading communities and forums where real traders share insights and case studies.
Many investors who invest in US stocks from India also use price action analysis and chart patterns to better understand market trends and identify potential trading opportunities in global markets.
Conclusion
Price action trading gives traders a clean, direct view of how markets move, helping them react instead of over-predicting. It builds a strong foundation for both intraday and swing strategies by combining candlesticks, chart patterns, and key levels.
While no method guarantees success, understanding how price action works is a must for anyone serious about trading.
FAQs
What is meant by price action in trading?
Price action trading refers to making trading decisions based purely on the movement of price over time, without heavy reliance on technical indicators. It focuses on candlestick patterns, support and resistance, and trendlines to understand market sentiment.
Is price action trading suitable for beginners?
Yes, beginners can learn price action trading, but it requires patience and practice. Since it avoids indicator clutter, it can help new traders build a clear understanding of market structure before moving to advanced tools.
Which chart patterns are used in price action trading?
Some common price action chart patterns include head and shoulders, double tops and bottoms, flags, pennants, and triangles. These patterns help traders identify potential breakouts, reversals, or continuation setups.
Is price action trading better than indicators?
Neither approach is “better” universally—it depends on the trader. Price action trading gives a clean, direct view of market behaviour, while indicators can provide confirmation. Many traders combine both for stronger signals.
Can price action be used for intraday trading?
Yes, price action is widely used for intraday strategies. Traders analyse candlestick formations, breakout levels, and support/resistance zones on lower timeframes to capture short-term moves.
Disclaimer
The information provided in this article is for educational and informational purposes only. It should not be considered as financial or investment advice. Investing in stocks involves risk, and it is important to conduct your research and consult with a qualified financial advisor before making any investment decisions. The author and publisher are not responsible for any financial losses or gains that may result from the use of this information.


