The Volume Weighted Average Price (VWAP) is one of the most widely used indicators in the stock market. It helps traders understand the average price at which a stock has traded during the day, adjusted for trading volumes.
VWAP plays an important role in intraday trading decisions, guiding traders on whether a stock is trading above or below its fair value for the session. In this article, we’ll cover the VWAP meaning, how it is calculated, its role in trading strategies, key differences from other indicators, and its limitations.
What is VWAP?
Volume Weighted Average Price (VWAP) is the average price at which a stock has traded during a specific period, with the calculation giving more weight to trades with higher volumes. Unlike a plain average, it shows where most of the trading activity happened.
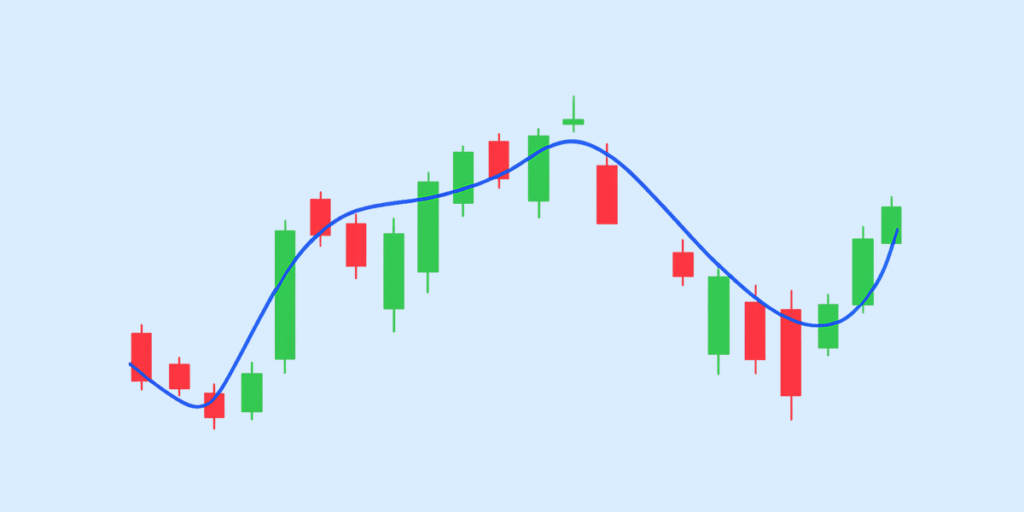
Traders use VWAP to check whether a stock is trading above or below its fair average price for the session. If the price is above VWAP, it may signal strong buying interest; if it’s below, it may suggest selling pressure.
How is VWAP Calculated?
The Volume Weighted Average Price (VWAP) is calculated by taking the ratio of the total price traded to the total volume traded during a given period. In simple terms, it shows the average price at which most trading took place, with more weight given to periods of higher volume.
The Formula
VWAP = (Cumulative (Price × Volume)) ÷ (Cumulative Volume)
Many charting platforms use the Typical Price instead of just the closing price to make the calculation more representative:
Typical Price = (High + Low + Close) ÷ 3
VWAP = (Cumulative (Typical Price × Volume)) ÷ (Cumulative Volume)
Breaking Down the Components
- Price: Either the trade price or the Typical Price for a period.
- Volume: Number of shares traded during that period.
- Cumulative Values: Running totals of both PV (price × volume) and volume from the beginning of the session.
This running calculation means VWAP isn’t a one-time figure; instead, it updates continuously throughout the trading day as new trades take place.
Step-by-Step Example
To understand VWAP better, we’ll calculate VWAP on a 5-minute chart for three periods:
- Period 1
- High = 100, Low = 98, Close = 99
- Typical Price = (100+98+99)/3 = 99
- Volume = 1,000
- PV (99 × 1,000) = 99,000
- Cumulative PV = 99,000
- Cumulative Volume = 1,000
- VWAP = 99,000/1,000 = 99.00
- Period 2
- High = 102, Low = 99, Close = 101
- Typical Price = 100.67
- Volume = 1,500
- PV (100.67 × 1,500) = 151,005
- Cumulative PV = 250,000
- Cumulative Volume = 2,500
- VWAP = 250,000/2,500 = 100.00
- Period 3
- High = 103, Low = 101, Close = 102
- Typical Price = 102
- Volume = 500
- PV (102 × 500) = 51,000
- Cumulative PV = 301,000
- Cumulative Volume = 3,000
- VWAP = 301,000/3,000 = 100.33
VWAP is always recalculated with each new trade or time interval and resets at the start of a new trading session. While most platforms calculate it automatically, understanding how it’s derived helps traders interpret whether a stock is trading at a fair value relative to the day’s activity.
VWAP vs Simple Moving Average (SMA)
Both VWAP and SMA are popular technical tools, but they work very differently, and that difference matters most in intraday trading.
How They Are Calculated
- Simple Moving Average (SMA): Takes the average of closing prices over a set number of periods (e.g., 20 or 50 bars) without considering trading volume.
- Volume Weighted Average Price (VWAP): Takes both price and trading volume into account, giving higher weight to periods where more shares were traded.
Why VWAP Is More Reliable for Intraday Trading
SMA smooths out price trends, but it treats all periods equally. In intraday trading, this can be misleading: a price move on very low volume carries the same weight as one on heavy volume.
VWAP solves this by showing the true average price where most of the day’s trading occurred.
| Aspect | VWAP (Volume Weighted Average Price) | SMA (Simple Moving Average) |
| Basis of Calculation | Considers both price and trading volume | Considers only price (closing prices) |
| Weighting | Heavier weight to prices with higher trading volume | Equal weight to all periods |
| Timeframe | Resets daily; mainly used for intraday trading | Can be calculated over any time period (short or long term) |
| Accuracy for Intraday | More accurate, it reflects where most trading occurred | Less accurate, as low-volume moves affect equally |
| Primary Use | Benchmark for fair value, institutional trading, intraday strategies | Trend identification, support/resistance levels |
| Limitation | Not useful for multi-day or long-term analysis | Ignores trading volume, may give false signals in volatile markets |
How is VWAP Used in Trading?
Traders and institutions actively use VWAP to guide their decisions during the day. Here are some use cases of VWAP:
Institutional Use
Large institutions and funds often rely on VWAP when they are executing bulk trades. They avoid pushing the market too far in one direction by breaking big orders into smaller ones and targeting the VWAP price. This helps them enter or exit positions smoothly without distorting prices.
Intraday Trading Strategies
For retail and intraday traders, VWAP is often used as a signal line:
- Buy Signal (Price < VWAP): If the stock is trading below VWAP but shows signs of recovery, traders may see it as undervalued and go long.
- Sell Signal (Price > VWAP): If the stock is trading above VWAP but starts weakening, it can be a sign of overvaluation which prompts short positions or profit booking.
VWAP works best when paired with price action or volume confirmation to avoid false signals.
Role in Algorithmic Trading
Many algorithmic trading systems are programmed to execute orders based on VWAP. Since it balances both price and volume, it acts as a reliable benchmark for fair execution in high-frequency or automated strategies.
Important Note
While VWAP is powerful for intraday decisions, it resets at the start of each new session. That’s why it’s not effective for long-term trading or investment strategies. For multi-day or long-term analysis, moving averages or other indicators are more appropriate.
Limitations of VWAP
VWAP is a popular and practical tool for intraday trading, but it has some drawbacks:
- Resets Daily: VWAP starts fresh at the opening of each session and resets at the close. This makes it less effective for multi-day or long-term trading decisions.
- Less Reliable in Volatile or Low-Volume Stocks: Sudden price spikes or thin trading volumes can distort VWAP readings, giving signals that don’t truly reflect market sentiment.
- Works Best with Other Indicators: VWAP on its own may give false buy/sell signals. Combining it with momentum indicators (like RSI) or trend tools (like MACD) improves accuracy.
Conclusion
VWAP is a reliable benchmark that shows where most trading activity has taken place during the day. When you combine price and volume, you get a clearer picture of fair value than a simple average.
While it’s highly effective for intraday strategies and widely used by both retail and institutional traders, it’s not designed for long-term analysis. Ultimately, traders should view VWAP as a reactive benchmark of the day’s trading activity, not as a predictive tool that forecasts future prices.
FAQs
What is the full form of VWAP?
The VWAP full form is Volume Weighted Average Price. In simple terms, VWAP meaning is the average price of a stock, weighted by the volume traded, during a given trading session.
Why is VWAP important in trading?
VWAP is important because it shows the fair price level at which most trades occurred. Traders use the volume-weighted average price as a benchmark to judge whether they are buying below or above the day’s average cost.
Is VWAP a lagging or leading indicator?
Since VWAP is calculated using historical price and volume data, it is considered a lagging indicator. It reacts to past activity and cannot predict future moves, but helps in understanding intraday price trends.
Can VWAP be used for long-term trading?
No, VWAP is best suited for intraday analysis. It resets each trading day, making it less useful for long-term trading or investment strategies. For longer horizons, moving averages or trend indicators are better suited.
What does it mean when the price is below VWAP?
When the price is below VWAP, it suggests the stock is trading at a discount to the day’s average. This can be interpreted in two ways: it could be a bearish sign of selling pressure, or for reversal traders, it might represent a potential buying opportunity if the price shows signs of recovering back toward the VWAP.
Disclaimer
The information provided in this article is for educational and informational purposes only. It should not be considered as financial or investment advice. Investing in stocks involves risk, and it is important to conduct your research and consult with a qualified financial advisor before making any investment decisions. The author and publisher are not responsible for any financial losses or gains that may result from the use of this information.

