
Quick Summary
- Bollinger Bands measure market volatility with a middle moving average and two standard deviation bands (upper and lower).
- The upper band signals overbought conditions, while the lower band signals oversold conditions.
- A Bollinger Band squeeze indicates low volatility and may precede a sharp breakout.
- Use RSI, MACD, and volume for confirmation when trading based on Bollinger Bands.
- Bollinger Bands are most effective when combined with other indicators and shouldn’t be used in isolation for entry/exit decisions.
- Bollinger Bands are one of the simplest yet most insightful tools traders use to understand market volatility. They visually show when prices are stretched too far—either rising too quickly or falling too sharply—helping traders anticipate possible reversals or breakouts.
In this blog, we’ll break down what Bollinger Bands are, how they work, how to read and trade them, the best supporting indicators, and their key advantages and limitations.
Bollinger Bands Definition
Bollinger Bands are a popular technical analysis tool used to measure market volatility and identify potential price extremes. John Bollinger created it in the 1980s and consists of three lines plotted on a price chart: a middle band (moving average) and two standard deviation bands (upper and lower).
In simple terms, Bollinger Bands show how far prices can move away from their average before becoming overbought or oversold. When prices move close to the upper band, they may be considered expensive; when near the lower band, they may be seen as cheap.
How Do Bollinger Bands Work?
Bollinger Bands work by tracking price movements relative to a moving average and dynamically adjusting to market volatility.
Here’s how each band functions:
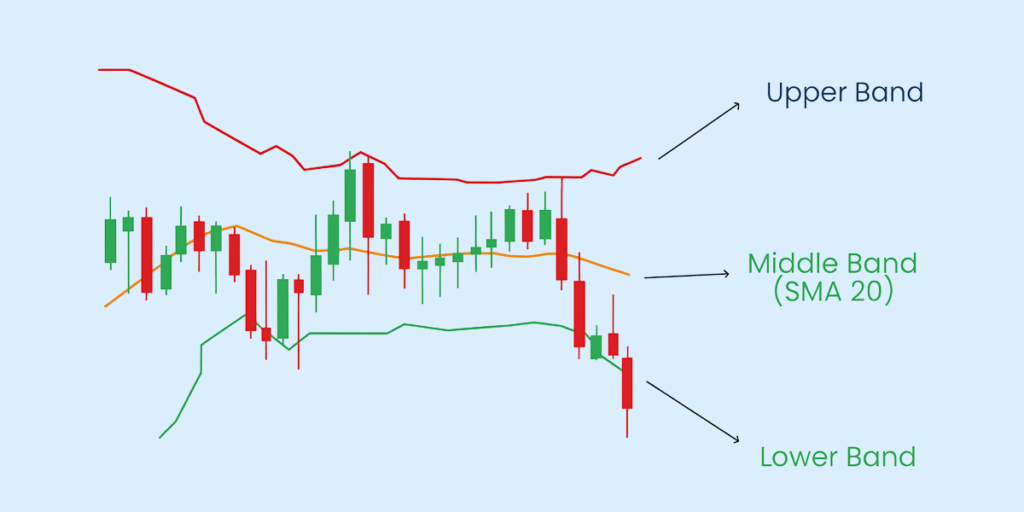
- Middle Band: A simple moving average (usually 20 periods) that represents the trend’s midpoint.
- Upper Band: This is plotted two standard deviations above the middle band; it shows the higher limit of expected price movement.
- Lower Band: It is plotted two standard deviations below the middle band; it marks the lower limit of expected price movement.
How to Read Bollinger Bands
Knowing how to read Bollinger Bands helps traders interpret market conditions with clarity—spotting when prices may be stretched or when volatility is building up. The bands act as visual boundaries that adapt to market behaviour.
Here’s what to look for:
1. Identifying Overbought and Oversold Zones
- When the price touches or moves above the upper band, it often shows overbought conditions. This suggests the price may be due for a pause or a pullback.
- When the price touches or dips below the lower band, it shows oversold conditions, suggesting a possible rebound.
2. Price Touching the Upper or Lower Bands
A price moving along the upper band during an uptrend indicates strong buying pressure, confirming bullish strength. Similarly, price hugging the lower band during a downtrend signals persistent selling pressure.
If the price frequently closes outside the bands, it can signal an accelerating trend, but if it quickly moves back inside, it may indicate exhaustion.
3. The Squeeze Pattern: Low Volatility Before Big Moves
A Bollinger Band squeeze occurs when the upper and lower bands converge, indicating low volatility. This tightening often precedes a sharp breakout — either upward or downward.
Traders watch for volume spikes or strong candlestick patterns after a squeeze to confirm the breakout’s direction.
How to Use Bollinger Bands in Trading
Knowing how to use Bollinger Bands helps traders make structured entry and exit decisions rather than relying on guesswork. These strategies can be applied across domestic and global markets, making them useful for investors who invest in US stocks from India and want to identify potential entry and exit opportunities using technical analysis.
- Entry & Exit Strategies:
- Go long when the price touches the lower band and starts turning up with RSI confirmation.
- Go short when the price nears the upper band and shows weakness or divergence.
- Take profits near the opposite band or when momentum slows.
- Breakout Trading with Bollinger Band Squeeze:
- Break above the upper band: Potential bullish move.
- Break below the lower band: Potential bearish move.
- Trend Confirmation vs Reversals:
- Price riding the upper band shows trend continuation.
- Price failing to reach a band after consistent touches hints at a reversal.
- Day Trading vs Swing Trading:
- Day trading: Use shorter settings (10–14 periods) for quicker reactions.
- Swing trading: Use standard 20-period settings to capture multi-day moves.
Bollinger Bands Strategy Examples
The best way to understand Bollinger Bands is to see them in action. These simple examples show how the pattern works across different markets: stocks, forex, and crypto:
- Stock Trading Example: A stock in consolidation shows a band squeeze. Price breaks above the upper band with volume surge—a buy signal. Exit when price flattens near resistance or the upper band widens sharply.
- Crypto/Forex Example: BTC/USD dips to the lower band while RSI is below 30. When it rebounds above the middle band, traders go long. Set a stop-loss below the lower band; exit near the upper band.
Advantages and Disadvantages of Bollinger Bands
Like any indicator, Bollinger Bands have their strengths and limits:
| Aspect | Advantages | Disadvantages |
| Flexibility | Works on all markets: stocks, forex, crypto | Can give false signals in sideways markets |
| Adaptability | Adjusts automatically with volatility | Needs confirmation from other indicators |
| Clarity | Easy to read and interpret visually | Doesn’t predict direction, only volatility |
| Strategy Fit | Useful for breakouts, reversals, and trend trades | Not effective as a standalone tool |
| Practical Use | Helps identify entry, exit, and momentum shifts | Requires context—price action and volume confirmation |
Indicators That Work Well With Bollinger Bands
Here are three indicators that complement Bollinger Bands best:
| Indicator | Purpose | How It Complements Bollinger Bands |
| RSI (Relative Strength Index) | Measures momentum and overbought/oversold zones | Confirms if the price touches near the upper/lower band is valid or overstretched |
| MACD (Moving Average Convergence Divergence) | Tracks momentum and trend shifts | Confirms direction when price breaks above or below the middle band |
| Moving Averages (SMA/EMA) | Identifies overall trend direction | Helps verify whether price action around the middle band aligns with the trend |
| Volume Indicators | Measures trading activity behind moves | Confirms if breakouts or squeezes have real strength |
| Stochastic Oscillator | Detects overbought and oversold levels | Works with Bollinger Bands to refine entry and exit timing |
Limitations and Best Practices
While Bollinger Bands are excellent for spotting volatility and potential reversals, they are not predictive tools. Here’s how to use them effectively:
- Don’t just rely on Bollinger Bands: Combine these bands with RSI, MACD, or volume for confirmation.
- Avoid trading every band touch: Price hitting the upper or lower band doesn’t always mean a reversal; wait for supporting signals.
- Check volume behaviour: Breakouts are more reliable when backed by rising volume.
- Use higher timeframes for cleaner trends: Daily or weekly charts filter out short-term noise.
- Be cautious in sideways markets: Frequent band touches can give false signals during low-volatility phases.
- Adjust settings based on asset volatility: More volatile assets may require wider bands; calm markets may need tighter ones.
FAQs
How do Bollinger Bands work in trading?
Bollinger Bands measure price volatility and identify potential overbought or oversold conditions. When prices approach the upper band, the asset is considered overbought; when they reach the lower band, it’s considered oversold.
Which Bollinger Band setting is best for day trading?
The most common setting for Bollinger Bands is a 20-period moving average with 2 standard deviations. For day trading, many traders adjust these values slightly to make the bands more responsive to short-term price action.
What is the success rate of Bollinger Bands?
There is no fixed success rate, as results depend heavily on the market, timeframe, and the trader’s strategy. Their reliability increases significantly when used in combination with confirmation tools such as RSI (to spot divergence), MACD, or volume analysis.
When should you buy with Bollinger Bands?
A common strategy for using Bollinger Bands is to look for buy signals when the price touches or dips below the lower band, then starts to move upward with increasing volume.
Do professional traders use Bollinger Bands?
Yes, many professional traders use Bollinger Bands as part of their technical toolkit. They’re particularly useful for identifying volatility shifts, potential breakout zones, and trend exhaustion points.
Disclaimer
The information provided in this article is for educational and informational purposes only. It should not be considered as financial or investment advice. Investing in stocks involves risk, and it is important to conduct your research and consult with a qualified financial advisor before making any investment decisions. The author and publisher are not responsible for any financial losses or gains that may result from the use of this information.


