
In technical analysis, chart patterns help traders make sense of price movements and identify possible opportunities. One such widely recognised formation is the bull flag pattern. It signals a pause within an ongoing uptrend, where prices consolidate briefly before continuing their move higher.
Traders value this pattern because it often indicates a continuation of bullish momentum, making it a useful guide for planning entries, exits, and managing risk. Keep reading to know more.
Understanding the Bull Flag Pattern
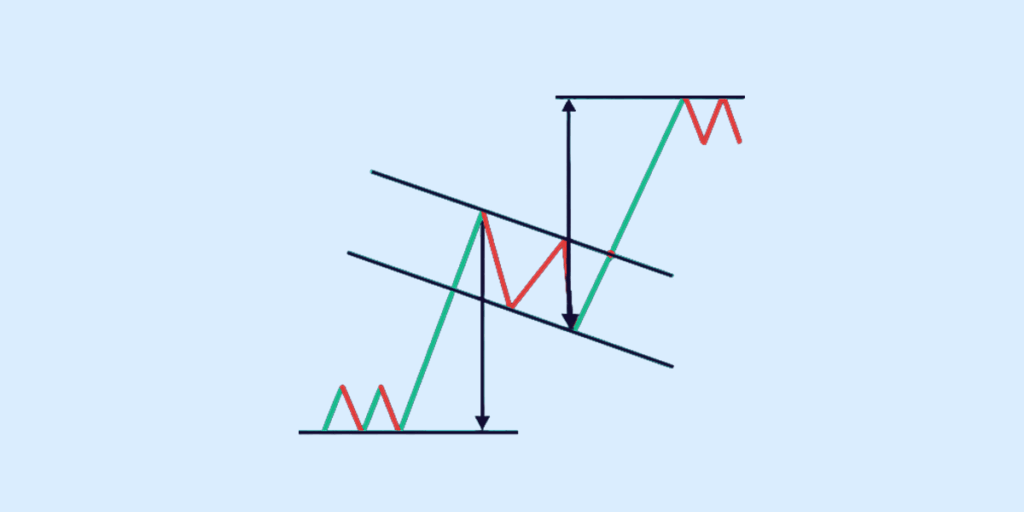
A bull flag chart pattern appears during an existing uptrend. It starts with a steep and rapid price increase—the flagpole—followed by a short consolidation period—the flag—and then a breakout above resistance. The consolidation usually forms a small rectangle or downward-sloping channel, representing a temporary pause rather than a reversal.
Components of a Bull Flag
To correctly identify a bull flag candlestick pattern, traders look for three key elements:
- Flagpole: A sharp (almost vertical) rise in price driven by strong buying momentum.
- Flag: A sideways or slightly downward consolidation zone, forming a rectangle or parallelogram.
- Breakout: The price moves above the consolidation phase, typically on higher volume which confirms the continuation of the uptrend.
Why Traders Consider It a Continuation Signal
The flag pattern in trading is viewed as a temporary pause where the market takes a breather before moving higher. Low volume during the consolidation and higher volume during the breakout strengthen the reliability of the pattern.
For traders, this setup provides an opportunity to enter long positions in line with the prevailing bullish trend rather than chasing the price after a big rally.
Characteristics of a Bull Flag Chart Pattern
The bull flag pattern is one of the most reliable continuation setups in technical analysis, but it’s important to know what to look for before trading it. Below are the defining features that traders watch closely when identifying a bull flag chart pattern:
1. Sharp Upward Price Move (Flagpole)
The first requirement is a strong bullish trend. This initial rally forms the “flagpole” and signals aggressive interest from buyers. Without a steep upward move, the pattern cannot be considered a bull flag.
2. Short Consolidation Phase (Flag)
Prices enter a brief consolidation, after the sharp rally. This is typically sideways or slightly downward and forms a small rectangle or parallelogram on the chart. Traders often mark this zone with parallel trendlines which represents short-term resistance and support.
3. Breakout to the Upside
The most crucial part of the pattern is the breakout. Once the price crosses above the upper resistance of the consolidation, it signals that buyers are back in control and the uptrend is likely to continue.
4. Importance of Volume
Volume is an important element when confirming the bull flag candlestick pattern. Typically:
- High volume during the flagpole rally.
- Declining volume during consolidation.
- A surge in volume at the breakout point.
This increase in trading activity helps validate that the breakout is genuine and not a false signal.
5. Bullish Continuation
The final confirmation is the continuation of the rally after the breakout. If the price sustains its upward momentum, the bull flag is considered successful.
Bull Flag vs Other Flag Patterns in Trading
While the bull flag pattern is one of the most popular continuation setups, it’s not the only one traders come across. Other patterns, like the bear flag or the pennant, share similar characteristics but signal very different outcomes.
| Pattern | Direction & Outlook | Key Characteristics | When It’s Seen |
| Bull Flag | Bullish continuation | Strong upward move (flagpole), short sideways/down consolidation, upside breakout | In momentum-driven stocks, after a steep rally |
| Bear Flag | Bearish continuation | Strong downward move (flagpole), brief upward/sideways consolidation, downside break | In weak stocks or falling markets, confirming further decline |
| Pennant Pattern | Can be bullish or bearish (depending on trend) | Similar to flags, but consolidation forms a small symmetrical triangle instead of a rectangle | Seen after a sharp price move in either direction, often with converging trendlines |
Why Bull Flag is Stronger in Momentum-Driven Stocks
The bull flag chart pattern is especially powerful in momentum-driven stocks because it often signals that institutional buyers are adding to positions after a sharp rally. The pause (consolidation) is simply a breather before the next leg up.
Unlike pennants, which can sometimes cause uncertainty, bull flags offer clearer entry and exit levels which makes them a preferred choice for many traders.
How to Trade a Bull Flag Pattern
Trading a bull flag pattern is all about timing your entry and managing risk effectively. Since the pattern signals a continuation of an existing uptrend, traders typically look for confirmation before entering. Here’s how you can approach it:
1. Identifying Entry Points
Enter when the price breaks out above the flag’s upper boundary. Many traders wait for the candle to close above the breakout level to avoid false signals. However, risk-tolerant traders may enter as soon as the breakout occurs but this also comes with higher risk.
2. Setting Price Targets
Measure the height of the flagpole (the sharp upward move before consolidation). Then, add this distance to the breakout level to estimate your target price. For example, if a stock rallies from ₹100 to ₹140 (flagpole = ₹40) and breaks out at ₹138, the target would be somewhere around ₹178.
3. Stop-Loss Placement
Place your stop-loss just below the lower boundary of the flag. This helps manage risk if the breakout fails and price moves back into the consolidation zone.
4. Using Volume as Confirmation
High trading volume during the breakout is an important confirmation signal. Volume should dip during the consolidation phase and spike again when the breakout occurs.
By defining your target and stop-loss before entering, you can calculate your risk-to-reward ratio. For example, if your stop-loss is ₹5 below your entry and your target is ₹15 above it, your R:R ratio is 1:3. Many traders look for setups that offer at least a 1:2 risk-to-reward ratio to ensure potential profits justify the risk.
Advantages and Limitations of Bull Flag Patterns
The bull flag pattern comes with both strengths and weaknesses, like any trading setup:
Advantages
- Clear Continuation Signal: Indicates that an existing uptrend is likely to continue.
- High Reward Potential: Targets can be set using the flagpole height, often providing favourable risk-to-reward ratios.
- Widely Recognised Pattern: Easy to spot on charts, making it popular among traders in stocks, forex, and crypto.
- Works Well in Strong Momentum Stocks: Particularly effective in fast-moving, trend-driven markets.
Limitations
- False Breakouts: Prices may briefly rise above resistance and then fall back, trapping traders.
- Volume Confirmation Needed: Without a surge in volume during breakout, the pattern may not hold.
- Context is Key: While very popular for intraday trading, bull flags are effective on all timeframes, including daily and weekly charts for swing traders. However, the reliability can decrease if the consolidation phase (the ‘flag’) drags on for too long, as this may signal waning momentum.
- Requires Quick Execution: Since moves after breakouts can be sharp, late entries may reduce profitability.
Real-Life Examples of Bull Flag Patterns
Here are some bull flag pattern examples that span across asset classes like stocks, crypto, and forex:
Bull Flag in Stock Market Charts
A stock that rallies strongly after a positive earnings report or a new product launch. After the surge, the price consolidates sideways in a small rectangle or slight downward channel—the “flag.”
Once volume picks up again, the breakout to the upside often signals another leg higher.
Bull Flag in Crypto Markets
Cryptocurrencies often move in sharp swings. For instance, after strong buying triggered by favourable news, a coin’s price may pause briefly in a tight consolidation zone.
Traders interpret this as a bull flag, preparing for continuation as long as volume supports the breakout.
Bull Flag in Forex Markets
In forex, a major currency pair like EUR/USD may climb rapidly due to an economic data release. The price then stabilises within a narrow range before breaking higher again.
Professional traders use candlestick formations and volume analysis to validate this setup.
How Professional Traders Spot Them
- They look for a steep flagpole, followed by low-volume consolidation, and then a breakout confirmed by higher volume.
- Across equities, forex, or crypto, the key remains the same: strong momentum, brief pause, and continuation.
Conclusion
The bull flag chart pattern, apart from just a visual shape on a chart, is a sign of strength in a rising market. By understanding how it forms and why it matters, traders can use it to assess continuation signals and adjust their trading strategies with greater confidence.
Also, With Appreciate, you can open your demat account online in just a few minutes and start investing right away, without paying any annual subscription fees. Plus, you get access to a global range of high-performing US stocks and ETFs, along with helpful tools to manage your portfolio based on your goals. Download the app now! and invest in US stocks from India.
FAQs
What does a bull flag pattern indicate in trading?
A bull flag pattern indicates a continuation of an uptrend after a brief consolidation. Traders see this as a sign that the strong upward momentum is likely to resume once the flag phase ends.
How do you identify a bull flag candlestick pattern?
You can identify a bull flag candlestick pattern by looking for a sharp upward price move (the flagpole) followed by a downward or sideways consolidation (the flag). This flag usually slopes slightly against the prevailing trend.
Is the bull flag chart pattern reliable in stock trading?
The bull flag chart pattern is considered one of the more reliable continuation setups in flag pattern trading, especially in trending markets. However, like all setups, it works best when confirmed with volume and other indicators.
What is the difference between a bull flag and a pennant pattern?
The main difference between a bull flag and a pennant is in the consolidation phase. A flag forms a rectangular or channel-like pattern, while a pennant appears as a small symmetrical triangle. Both are continuation patterns, but their shapes differ.
Can the bull flag pattern be used in crypto trading?
Yes, the bull flag pattern can also be used in crypto trading. Since it reflects price momentum and consolidation, it applies across asset classes, including stocks, forex, and cryptocurrencies.
Disclaimer
The information provided in this article is for educational and informational purposes only. It should not be considered as financial or investment advice. Investing in stocks involves risk, and it is important to conduct your research and consult with a qualified financial advisor before making any investment decisions. The author and publisher are not responsible for any financial losses or gains that may result from the use of this information.


