Quick Summary:
- Stock charts allow traders to see price trends, patterns, and volume in trading, thus allowing traders to make well-informed decisions relative to the price, the market’s trading history.
- Line, Bar, and Candlestick charts may provide traders with three different views of stock price data, and the trends that develop over time using several periodic time increments.
- Key elements of charts include the ticker symbol, the period or overall time increment seen in the chart, OHLC data (open, high, low, and close), and actual price movements.
- Technical indicators like moving averages, relative strength index (RSI), MACD (Moving Average Convergence Divergence), and Bollinger Bands are other examples of categories of indicators that can help identify trends and market conditions when utilizing stock charts.
- In trading, support and resistance levels are important for identifying potential entry and exit points, and need to be well understood.
Why Learning to Read Stock Market Charts is Essential
Stock charts reveal historical price data and are vital for identifying bullish trends (price increases) and bearish trends (price decreases). They allow you to act based on reliable data rather than guesswork.
Overview of Stock Market Charts and Their Role in Investing
Stock market charts help identify potential entry points and stop-loss orders, ensuring you make informed decisions. Let’s explain the most commonly used chart types and their role in stock chart analysis.
Also Read: Tick Size in Trading
Fundamentals of Stock Market Charts
Stock charts visually represent price movements and trading volume, making it easier to identify market sentiment and predict future trends. Let’s explore this in more detail.
What is a Stock Chart?
A stock chart is a graphical representation of a stock’s price fluctuations. It uses two axes: the Y-axis represents the stock’s price, while the X-axis shows the period (daily, weekly, or yearly data).
Why You Should Learn to Read Stock Charts
Here are some key reasons to learn stock chart analysis:
- Spot an uptrend (rising prices) or a downtrend (falling prices).
- Pinpoint the best entry and exit points.
- Recognise whether bullish or bearish dominates the market.
- Identify support levels (where a stock tends to stop falling) and resistance levels (where it tends to stop rising), which can guide your trades.
Key Components of a Stock Chart
Here are some of the main components of a stock chart:
Ticker symbol
The ticker symbol is the stock’s unique identifier, such as AAPL for Apple. It’s displayed on the chart, so you know exactly which stock you’re analysing.
Chart period
The chart period refers to the timeframe displayed, such as intraday, daily, weekly, or yearly.
OHLC data
OHLC data (Open, High, Low, and Close prices) explains how a stock’s price moved during the selected period.
Price movement
The price movement shows how the stock’s value has fluctuated over time. This movement helps you evaluate whether the stock is in an uptrend, a downtrend, or a sideways trend.
Types of Stock Market Charts
Here’s a more in-depth look at the different types of charts:
Line Charts
A line chart connects a series of closing prices over a selected period, forming a continuous line. This basic stock chart type offers a clear view of long-term trends.
What is a Line Chart?
A line chart shows how a stock’s closing price changes over time. It’s easy to read and perfect for tracking stock market trends or price fluctuations over longer periods.
Advantages of Line Charts
- Easy to understand, making it suitable for beginners due to its clarity.
- It focuses on closing prices, eliminating minor intraday fluctuations and providing a cleaner view of the stock’s performance.
Bar Charts
A bar chart is a graphical representation of a stock’s price and volume over time. It is a popular tool for investors to study market fluctuations and detect patterns.
What is a Bar Chart?
A bar chart shows the stock’s opening price, the highest and lowest prices of the day, and the closing price.
How to Interpret Bar Charts
- The top of the bar shows the stock’s high price, and the bottom shows the low price.
- The small horizontal line to the left represents the opening price, and the one on the right shows the closing price.
- A rising bar indicates an uptrend, while a falling bar suggests a downtrend.
Candlestick Charts
Candlestick charts originated in Japan and first appeared in the 1700s. Munehisa Homma, a rice dealer, is credited with developing the concept.
What are Candlestick Charts?
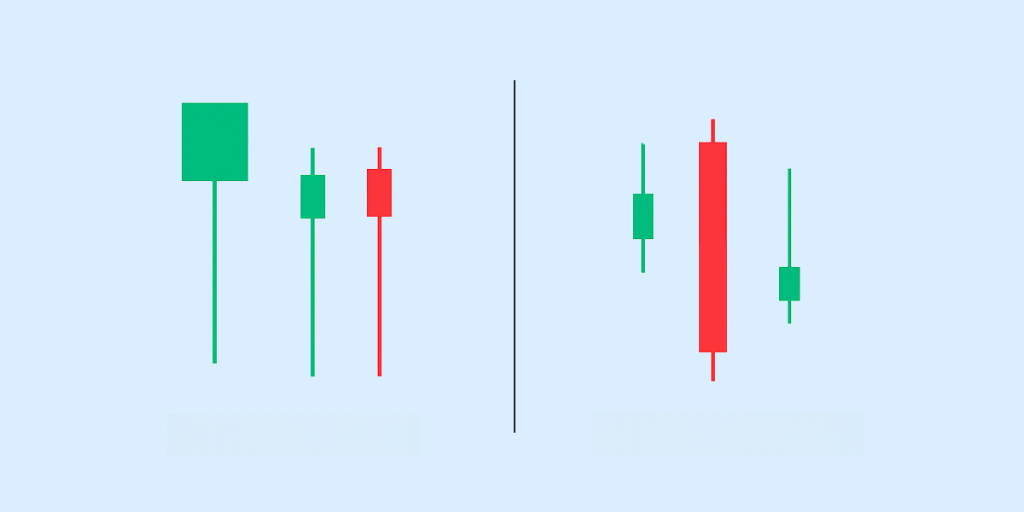
Each “candle” represents a specific period and shows the opening, high, low, and closing prices. The candle body shows whether the stock closed higher or lower than it opened, while the wicks (shadows) show the price range.
How to Read Candlestick Charts
- A green (or hollow) candle shows the stock closed higher than it opened (bullish).
- A red (or filled) candle indicates the stock closed lower than it opened (bearish).
Common Candlestick Patterns
Here are some key candlestick patterns to watch for:
Doji
A doji forms when the starting and closing prices are nearly identical, signalling market indecision and a possible trend reversal.
Engulfing
An Engulfing pattern happens when a larger candle completely “engulfs” the previous smaller candle, suggesting a potential trend reversal.
Hammer
A Hammer appears at the bottom of a downtrend and has a small body with a long lower wick. It indicates that buying pressure is pushing the stock price higher, possibly leading to a reversal.
Key Concepts in Stock Chart Analysis
The core concepts of stock chart analysis include:
Price Movements
When you follow a stock’s daily price movement, you can gauge the strength of the uptrend, downtrend, or sideways patterns.
How to Track Price Movements on Stock Charts
To track price movements, focus on the stock’s opening and closing prices and price range. Also, tools like candlestick patterns give you a clear visual of these shifts, helping you spot bullish or bearish trends.
Net Change
The net change reflects how much a stock’s price has shifted from opening to closing.
Volume Analysis
Volume analysis studies the number of shares traded over a specific period to understand market trends and trader activity.
Why Volume is Important in Stock Charts
Combining volume with price changes offers a clearer picture of market sentiment and helps confirm the strength of a trend.
How to Use Volume Data
You can use volume data to confirm price movements and identify market sentiment. High volume during an uptrend indicates strong buying pressure, while high volume during a downtrend signals strong selling pressure.
Support and Resistance Levels
These levels help you determine optimal entry points and set stop-loss orders to minimise risk. Here is some more information on these levels:
What are Support and Resistance Levels?
The price tends to stop falling at a support level because of strong buying interest. A resistance level is where the price struggles to rise due to selling pressure.
How to Use Support and Resistance in Trading
When a stock hits a support level and bounces, it could be a good entry point. If a stock nears a resistance level and stalls, it might be time to exit the trade or place a stop-loss just below to limit your risk.
Advanced Technical Indicators
Below are some key indicators to help you navigate stock chart analysis effectively.
Moving Averages (MA)
Moving averages are a fundamental tool in technical analysis that smooths out price fluctuations to reveal trends.
What are Moving Averages?
Moving averages track the average closing price of a stock over a specified period, helping to spot long-term trends.
Simple Moving Average (SMA) vs. Exponential Moving Average (EMA)
SMA gives equal weight to all closing prices over a set period – ideal for detecting long-term trends. On the other hand, EMA prioritises more recent prices, making it better for short-term trends.
Relative Strength Index (RSI)
The RSI indicator is a momentum tool that calculates a stock’s strength or weakness based on closing prices over a specific time.
Understanding RSI
RSI is usually measured on a scale of 0 to 100, with levels above 70 indicating an overbought market and below 30 indicating an oversold market.
How to Use RSI
RSI helps you determine whether a stock is overbought (potential selling opportunity) or oversold (potential buying opportunity). Moreover, RSI can signal potential trend reversals, especially when it diverges from price.
MACD (Moving Average Convergence Divergence)
MACD is a popular trend-following indicator that measures the relationship between two moving averages.
What is MACD?
The MACD consists of two lines—the MACD line and the signal line—along with a histogram showing the difference between them.
How to Interpret MACD?
A buy signal reflects when the MACD line is above the signal line, showing a bullish trend. A sell signal reflects when the MACD line crosses below the signal line, pointing to a bearish trend.
Bollinger Bands
Bollinger Bands are a volatility measure that shows how far the price deviates from the moving average.
What are Bollinger Bands?
These bands consist of three lines: the middle line (a moving average) and two outer lines (standard deviation bands). The space between these bands widens or narrows based on market volatility.
Using Bollinger Bands to Identify Market Conditions
When the bands widen, it indicates increased market volatility. In contrast, narrow bands suggest less price movement. Prices touching or crossing the upper or lower band may also indicate potential breakouts or trend shifts.
Chart Patterns and Their Importance
Let’s discuss some of the most common chart patterns in the stock market:
Head and Shoulders
The Head and Shoulders pattern includes three peaks, the middle being the highest (head) and the two lower peaks (shoulders) forming either side.
Double Top and Double Bottom
The Double Top is a bearish reversal pattern that occurs when a stock hits a price peak twice and fails to break through, signalling that the uptrend may be over. Conversely, the Double Bottom indicates a bullish reversal, forming when a stock hits two low points before rebounding.
Triangle Patterns (Ascending, Descending, Symmetrical)
Triangle patterns show a period of consolidation before a breakout, giving traders insight into potential price fluctuations. These include:
- Ascending Triangle: This pattern suggests that buying pressure is increasing, and a breakout to the upside is likely.
- Descending Triangle: Indicates growing selling pressure and a potential downside breakout.
- Symmetrical Triangle: Signal indecision in the market, where a bullish or bearish breakout could occur.
Choosing the Right Chart Type Based on Your Trading Strategy
Here are some tips to help you choose the right chart type:
- Line charts are ideal for spotting long-term trends and tracking closing prices. Use this for a simple overview of historical price data.
- Bar or Candlestick charts are perfect for detailed analysis of price fluctuation and OHLC data. These charts help identify price ranges, bullish trends, and bearish trends.
- Candlestick patterns are useful for spotting reversal signals and understanding market sentiment. They are also ideal for making short-term trading decisions, such as setting entry points or stop-loss orders.
Combining Technical and Fundamental Analysis
Combining both technical and fundamental analysis allows you to assess price movements and the company’s intrinsic value. For instance, technical tools like the RSI indicator can tell if a stock is overbought or oversold, which signals potential momentum changes. But you’ll also want to consider earnings reports or revenue trends to determine if the company’s growth justifies its price.
Note: Once you’ve made the decision to invest in shares/stocks, the next critical step is to keep a close watch on how they perform in the market and actively manage your portfolio. Using our Share Price Average Calculator, you can effortlessly compute the average price of all your purchases, whether at different times or prices. You can use this calculator before you buy more shares of a stock you already own to better understand the average price you will have paid for all shares of that stock.
FAQs
What is the best chart type for beginners to start reading stock charts?
Line charts are a good starting point for beginners because they provide a simple view of price trends. They help you focus on the overall movement without getting overwhelmed by too much detail.
How do candlestick patterns indicate potential price reversals?
Candlestick patterns, such as dojis or engulfing patterns, show shifts in buying and selling pressure. These shifts often signal that a trend may flash in future.
What is the significance of volume when analysing stock charts?
Volume shows the strength of a price movement by indicating how many shares were traded during a specific period. High volume during price changes can confirm the trend, while low volume may signal a weak move.
How can support and resistance levels help in setting stop-loss orders?
Support and resistance levels act as barriers where price movements often reverse or stall. Setting stop-loss orders just below support or above resistance can help protect against sudden reversals.
How do moving averages help identify long-term trends?
Moving averages smooth out price data, making it simple to spot long-term trends. When the price is above a moving average, the stock is generally in an uptrend; below it is a downtrend.
What is RSI, and how can it indicate whether a stock is overbought or oversold?
RSI (Relative Strength Index) measures the speed and difference in price movements on a scale from 0 to 100. Values above 70 suggest a stock is overbought, while values below 30 indicate oversold shares.
How do Bollinger Bands show volatility in the stock market?
Bollinger Bands include a moving average and two standard deviation lines. Widening bands signal increased volatility, while narrowing bands indicate reduced volatility.
What is MACD, and how can it signal changes in market momentum?
Moving Average Convergence Divergence compares two moving averages to recognise momentum shifts. When the MACD line crosses above the signal line, it can indicate bullish momentum, and crossing below can suggest bearish momentum.
How do chart patterns like Head and Shoulders indicate a trend reversal?
The Head and Shoulders pattern happens after an uptrend and signals a potential trend reversal. Once the neckline is broken, it suggests that the stock may shift from a bullish to a bearish phase.
Should investors use both technical and fundamental analysis for better trading results?
Technical and fundamental analysis offers a complete view of a stock’s potential. Technical analysis helps with timing, while fundamental analysis focuses on the stock’s long-term value.
How do double-top and double-bottom chart patterns indicate market direction?
A double top indicates a potential downtrend after a stock reaches a resistance level twice and fails to break it. Conversely, a double bottom suggests an uptrend might follow after testing a support level twice.
How does the time frame selected on a stock chart impact trading decisions?
The time frame on a stock chart affects trading decisions by providing insights into short-term versus long-term trends. Shorter time frames are used for quick trades, while longer time frames help in making investment decisions.
Disclaimer: Investments in securities markets are subject to market risks. Read all the related documents carefully before investing. The securities quoted are exemplary and are not recommendatory.


