
The Marubozu candlestick pattern is one of the clearest visual cues of strong market conviction. Unlike most candles that show some price hesitation through wicks, a Marubozu has none—it reflects a session where buyers or sellers were in full control from open to close.
This pattern is not just about shape; it captures momentum in its purest form. Whether you trade trends or look for reversals, recognising a Marubozu can help you act early, particularly when it is in alignment with broader market context or technical setups.
Keep reading to know more!
Introduction to Candlestick Patterns
Candlestick charts are among the most commonly used tools in technical analysis. Each candle represents price movement within a set time frame, which shows the opening, closing, high, and low prices. You can use them to understand price direction and market sentiment quickly.
These patterns help you identify potential reversals, continuations, or indecision in price movements. They are also used to make short-term trading decisions based on historical price behaviour, as they visually capture market psychology in a structured format.
A Marubozu is a specific type of candlestick that has no upper or lower shadow (the “wicks”). This shows that the opening and closing prices are also the highest and lowest prices during that period. It reflects strong market conviction — either bullish (buyers in control) or bearish (sellers in control). Marubozu is considered a high-conviction candle, and it often sets the tone for the next move in the same direction.
How does a Marubozu pattern work?
A Marubozu candle pattern shows strong price movement in a single direction, with no upper or lower shadows. A bullish Marubozu (or white Marubozu candlestick pattern) opens at the low and closes at the high, signalling buyer dominance.
A bearish Marubozu does the opposite—opening at the high and closing at the low, reflecting strong selling pressure. The candlestick Marubozu is often used to confirm trend strength or hint at a reversal, depending on its position on the chart.
Types of Marubozu Candle Patterns
The Marubozu candle pattern comes in two main types: bullish and bearish. Both are defined by a long real body and little to no shadows (wicks), indicating strong conviction by either buyers or sellers.
These patterns are easy to spot due to their “bald” appearance and are considered strong signals for trend continuation or reversal, depending on where they appear on the chart.
Bullish Marubozu
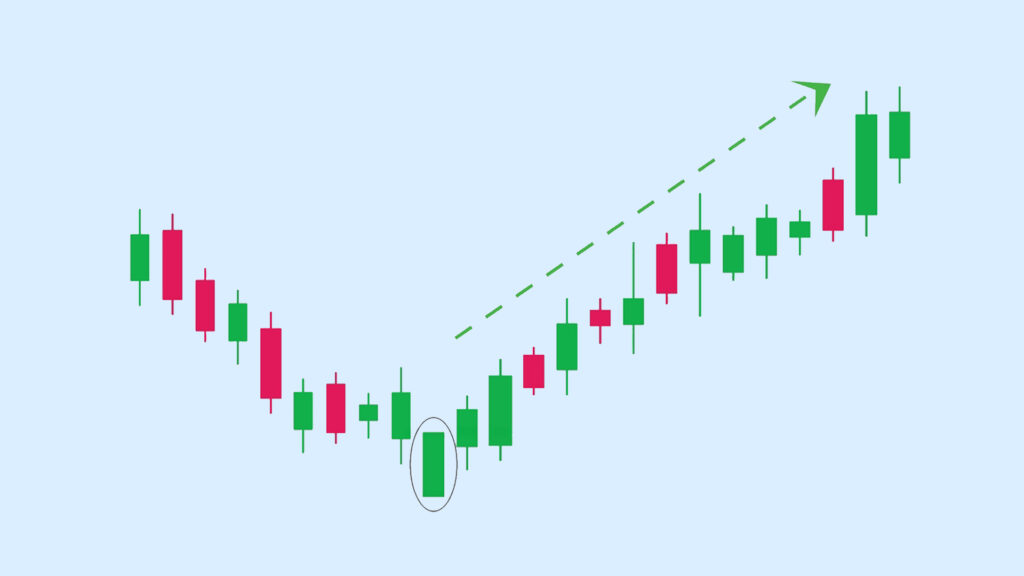
Also known as the white Marubozu candlestick pattern, this appears as a long white (or green) candle with no upper or lower shadows. It opens at the lowest price of the session and closes at the highest. This pattern is typically found in:
- An ongoing uptrend that confirms buyer strength and signals continuation.
- A consolidation zone which suggests the bulls have regained control after a period of indecision.
The bullish Marubozu candle reflects strong buying pressure throughout the session, where sellers had little or no influence on price action. It is a clear signal that buyers dominated from open to close.
Bearish Marubozu
The bearish Marubozu—often referred to as the black Marubozu—is a long red or black candle with no wicks. It opens at the highest point and closes at the lowest. This type of Marubozu typically appears:
- In an ongoing downtrend, confirming strong selling activity
- At potential reversal zones, such as the end of an uptrend or near resistance
This Marubozu candle reflects intense selling pressure, where sellers controlled the session and buyers were unable to push prices back at any point.
How to Interpret Marubozu Candles in Trading
A Marubozu candle gives you strong insight into market sentiment. Whether bullish or bearish, it reflects a session dominated by one side with no sign of resistance from the other. Understanding how to read this helps you decide whether a trend will be continuing or reversing.
Signals for trend continuation or reversal
A bullish Marubozu during an uptrend confirms buyer strength and suggests the trend may continue. When this pattern forms after a downtrend or sideways movement, it can signal a reversal, showing that buyers have taken control.
Similarly, a bearish Marubozu in a downtrend supports continuation, while its appearance at the top of an uptrend may signal a reversal.
Psychological meaning behind open-close extremes
The open and close levels in a candlestick Marubozu pattern are extreme. A bullish Marubozu candle opens at the lowest price and closes at the highest, indicating buyers were in control the entire time, with no selling pressure strong enough to cause a pullback.
The opposite applies for bearish Marubozu candles. This total control reflects strong conviction from either buyers or sellers, giving the pattern its significance.
Importance of confirmation on the next candles
While the Marubozu candle pattern is powerful, you should not use it in isolation. Make sure to always look for confirmation from the next few candles. The same principle applies to investors who invest in US stocks from India, as relying on a single indicator or chart pattern without broader market confirmation can increase investment risk.
For example, if a bullish Marubozu is followed by higher closes or a breakout that is above resistance, it supports the signal. If price stalls or reverses immediately, it may indicate that the pattern failed due to nearby resistance or lack of follow-through volume.
Difference Between Marubozu and Other Candlesticks
The Marubozu candle pattern is distinct in its appearance and meaning, especially when compared to other common candlestick types. Below is a comparison table to help you understand how it differs from patterns like the Doji, Hammer, and Engulfing:
| Feature | Marubozu | Doji | Hammer | Engulfing |
| Body | Long body with no wicks (or very small) | No real body (open and close are nearly the same) | Small body, long lower shadow | The body of the second candle completely engulfs the body of the previous one. |
| Wicks (Shadows) | None or very minimal | Long upper and/or lower wicks | Long lower wick, very short or no upper wick | Varies depending on market conditions |
| Psychological Meaning | Strong dominance by buyers (bullish) or sellers (bearish) | Indecision or balance between buyers and sellers | Possible reversal after selling pressure; buyers stepping in | Momentum shift — second candle confirms control reversal |
| Common Trend Context | Continuation or reversal, depending on position | Appears during indecision or potential reversal | Found at the bottom of downtrends | Found at trend reversals (top or bottom) |
Conclusion
The Marubozu candle pattern is a clear signal of strong market momentum, whether bullish or bearish. Its long body and absence of wicks indicate that one side dominated the session from start to finish, which makes it a useful tool for identifying trend continuation or potential reversals.
However, like all candlestick patterns, the Marubozu is most effective when used with other technical tools such as support/resistance levels, volume analysis, or indicators. To build confidence, start by observing Marubozu patterns in past charts or using demo accounts for backtesting. This will help you refine your entries and make more informed trading decisions.
FAQs
What does a bullish Marubozu candle indicate?
A bullish Marubozu candle indicates strong buying pressure. It opens at the lowest price and closes at the highest which shows buyers were in control throughout the session. It often signals trend continuation in an uptrend or potential reversal after a downtrend.
Is the Marubozu pattern reliable for intraday trading?
Yes, the Marubozu candle pattern can be used in intraday trading, but it should be combined with other indicators such as volume, support and resistance levels, or moving averages for better accuracy. Confirmation from the next candle is also important before acting.
What is the difference between a white Marubozu and a bullish Marubozu?
The terms white Marubozu and bullish Marubozu refer to the same pattern — a long white (or green) candle with no shadows. Both indicate strong bullish sentiment. The word “white” simply describes the candle’s colour on most charts.
How can I confirm a Marubozu signal before entering a trade?
You can confirm a Marubozu signal by checking for follow-up candles in the same direction, increased volume, or a breakout above a resistance (in bullish cases) or below a support (in bearish cases). This lowers the risk of false signals.
Can Marubozu candles appear during market reversals?
Yes, Marubozu candles can appear at reversal points. A bullish Marubozu at the end of a downtrend may signal a shift to buying pressure. Likewise, a bearish Marubozu at the top of an uptrend may indicate the start of selling pressure. Use context and confirmation to assess the setup.
Disclaimer
The information provided in this article is for educational and informational purposes only. It should not be considered as financial or investment advice. Investing in stocks involves risk, and it is important to conduct your research and consult with a qualified financial advisor before making any investment decisions. The author and publisher are not responsible for any financial losses or gains that may result from the use of this information.


