
In fast-moving markets, traders often look for brief pauses in price before the next big move, and that’s where the pennant chart pattern comes in. It’s not just a visual shape on the chart; it’s a signal of market psychology in action.
After a strong price rally or decline, a pennant shows temporary consolidation, as if the market is catching its breath before continuing in the same direction.
In this blog, we’ll break down the structure of a pennant pattern, the key types (bull and bear), how it differs from flag patterns, and practical strategies for trading it with confidence.
Structure of a Pennant Pattern
Here’s how the pattern typically forms and what each part signifies:
Formation: Sharp Move Followed by Consolidation
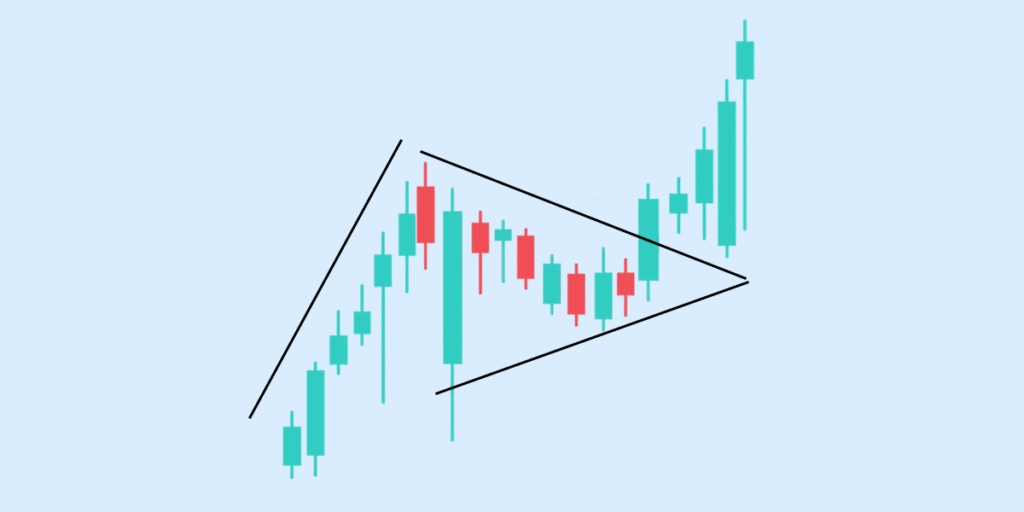
A pennant pattern begins with a strong price movement in one direction—either upward or downward—known as the flagpole. This sharp move is driven by high momentum and volume. After this, the price enters a brief consolidation phase, where it moves in a tighter range, forming the body of the pennant.
Role of Converging Trendlines
During the consolidation, the price action forms two converging trendlines, resembling a small symmetrical triangle. These lines connect lower highs and higher lows, indicating indecision or a temporary pause in the trend. This narrow price range builds up pressure before the breakout.
Duration and Breakout Direction
Pennant patterns are typically short-term, lasting from a few sessions (for intraday charts) to several days or weeks (on daily charts). Once the pattern completes, a breakout occurs in the direction of the prior trend, confirming it as a continuation pattern.
Whether it’s a bull pennant or a bear pennant, the breakout is usually accompanied by a surge in volume, signalling renewed momentum.
Types of Pennant Patterns
Pennant patterns are classified based on the direction of the underlying trend. They are both continuation patterns, meaning they suggest that the prior trend is likely to resume after a short pause.
Bull Pennant
A bull pennant forms after a sharp upward price movement (called a flagpole), followed by a brief consolidation with converging trendlines. This pattern typically appears in strong uptrends and signals that the bullish momentum is likely to continue after the breakout.
Bear Pennant
A bear pennant appears after a steep decline, where prices consolidate temporarily in a small symmetrical triangle before continuing downward. It signals bearish continuation and is commonly found in high-volume downtrends.
Flag and Pennant Pattern
The flag and pennant patterns are often grouped because they both represent continuation patterns and often appear in similar market contexts. However, they differ slightly in structure:
- A flag pattern forms a rectangular consolidation channel.
- A pennant pattern forms a small symmetrical triangle.
Despite this difference, both are interpreted as continuation setups and traded in similar ways with breakout confirmation and proper risk management.
Flag vs Pennant Pattern – Key Differences
While both patterns represent a pause before the trend continues, they are visually and structurally distinct. Here’s a comparison to help you differentiate:
| Feature | Flag Pattern | Pennant Pattern |
| Shape | Rectangular channel (parallel lines) | Small symmetrical triangle (converging lines) |
| Consolidation Angle | Slopes slightly against the trend | Typically horizontal or neutral |
| Duration | Slightly longer consolidation | Shorter and more compact |
| Trendlines | Parallel | Converging |
| Breakout Direction | In the direction of the prior trend | In the direction of the prior trend |
| Volume During Formation | Gradual decrease | Volume contracts inside the pennant |
How to Trade the Pennant Pattern
Trading the pennant pattern requires a disciplined approach, focusing on confirmation signals, risk control, and reliable tools. Here’s how to trade the flag and pennant pattern step by step.
Entry Strategy: Wait for a Breakout Confirmation
The best time to enter a pennant pattern trade is after a clear breakout from the pattern’s trendlines:
- For a bull pennant, wait for the price to break above the upper trendline with strong volume.
- For a bear pennant, enter only after a breakdown below the lower trendline with volume support.
Avoid guessing the breakout direction before it actually happens—confirmation is key.
Setting Stop-Loss and Target Levels
Risk management is crucial when trading a pennant pattern stock:
- Stop-Loss Placement: Place the stop-loss just outside the opposite end of the pattern. For a bull pennant, keep it below the lower trendline; for a bear pennant, set it above the upper trendline.
- Target Price: Measure the height of the flagpole (initial sharp move) and project that distance from the breakout point. This gives you a realistic profit target based on price momentum.
Tools to Validate the Pattern
Use technical tools to increase the reliability of the pattern and avoid false breakouts:
- Volume: A strong breakout should come with a spike in volume. Low-volume breakouts are less trustworthy.
- Trendlines: Draw clear, converging trendlines during the consolidation phase to define the pennant boundaries.
- Moving Averages: Use short-term moving averages (like the 20 EMA) to confirm the direction of the breakout and align your entry with the broader trend.
Real-World Example
Let’s say you’re analysing Apple Inc. (AAPL) on a 1-hour chart:
- After a sharp uptrend, AAPL consolidates into a tight range with converging trendlines, forming a bull pennant.
- Volume drops during consolidation and then surges as the price breaks above the upper trendline.
- You enter the trade on breakout confirmation, set a stop-loss just below the pennant, and project a target equal to the length of the previous rally (flagpole).
Benefits and Limitations of the Pennant Pattern
The pennant pattern is a widely used continuation pattern in technical analysis, valued for its clarity and adaptability. However, like any trading setup, it comes with both strengths and risks. Here’s a breakdown to help you use it more effectively.
Strengths of the Pennant Pattern
The pennant pattern offers several key advantages for traders looking to follow strong trends:
- Clear Entry and Exit Points: The pattern forms defined trendlines that help you pinpoint breakout zones and place accurate stop-loss levels.
- Works Across All Timeframes: Whether you’re an intraday trader or swing trader, the flag and pennant pattern can be applied effectively across different chart durations. This is equally useful if you invest in US stocks from India, as these chart patterns work across both Indian and US markets.
- Trend Continuation Confirmation: When backed by volume, a breakout from the pennant pattern often confirms the strength of the ongoing trend, improving your trade conviction.
Limitations of the Pennant Pattern
Despite its benefits, there are important risks to consider when trading a pennant pattern stock setup:
- False Breakouts Are Common: A major drawback is the frequency of false signals, where the price breaks out briefly and then reverses sharply.
- Requires Additional Confirmation: Relying on the pattern alone can be risky. You need volume or indicators like RSI/MACD to validate a true breakout.
- Subjectivity in Drawing the Pattern: Drawing the converging trendlines can vary from trader to trader, which may lead to inconsistent interpretations.
Best Practices to Minimise Risk
To use the flag and pennant pattern more effectively and reduce potential losses, follow these best practices:
- Wait for Volume Confirmation: A volume spike should accompany a strong breakout. Avoid entering the trade until you see this signal.
- Use Protective Stop Losses: Always place stop-loss orders just outside the pattern’s boundary, below for bull pennants and above for bear pennants.
- Combine with Technical Indicators: Validate your setup using momentum indicators like MACD or RSI to improve accuracy.
- Stick to Trend-Driven Markets: Pennant patterns work best during strong trending phases. Avoid using them in sideways or low-volatility conditions.
Conclusion
The pennant pattern is a powerful continuation signal that helps you catch the next leg of a trend after a sharp price move. Its compact structure, clear breakout points, and compatibility across timeframes make it a practical tool for both intraday and swing traders.
For traders, the key is not just spotting the pattern but trading it with discipline — waiting for volume confirmation, using proper stop-loss levels, and combining it with other indicators. When used thoughtfully, the flag and pennant pattern can significantly improve your trade timing and trend-following strategy.
FAQs
What is a pennant pattern in trading?
A pennant pattern in trading is a short-term continuation pattern that forms after a sharp price movement, followed by a brief consolidation with converging trendlines. It resembles a small symmetrical triangle and typically signals the continuation of the prior trend once the breakout occurs.
How is a bull pennant different from a flag pattern?
A bull pennant differs from a flag pattern mainly in its shape. In a bull pennant, the consolidation area forms a small symmetrical triangle, while in a flag pattern, it forms a parallelogram or rectangle. Both are continuation patterns, but the flag and pennant patterns differ in structure. Bull pennants typically follow a sharp upward price movement and signal a likely continuation of the uptrend after the breakout.
How can I identify a pennant pattern on a stock chart?
To identify a pennant pattern on a stock chart, look for a sharp price spike (flagpole) followed by a brief period of sideways movement with converging trendlines (the pennant). Volume usually drops during the consolidation phase and spikes again during the breakout. These clues help spot a pennant pattern stock setup more confidently.
Are pennant patterns reliable for intraday trading?
Pennant patterns can be reliable for intraday trading if confirmed by volume and other indicators like RSI or MACD. The flag pennant pattern is often used in high-volatility sessions, especially during strong price movements. However, false breakouts are common, so intraday traders must wait for clear confirmation before entering a trade.
What does a breakout from a pennant pattern indicate?
A breakout from a pennant pattern indicates a potential continuation of the previous trend. In a bull pennant, the breakout suggests further upward movement, while in a bear pennant, it points to continued downside. The breakout is typically accompanied by increased volume, making it a key moment for executing trades based on the flag and pennant pattern.
Disclaimer
The information provided in this article is for educational and informational purposes only. It should not be considered as financial or investment advice. Investing in stocks involves risk, and it is important to conduct your own research and consult with a qualified financial advisor before making any investment decisions. The author and publisher are not responsible for any financial losses or gains that may result from the use of this information.


