
The triple top pattern is a classic bearish reversal signal that traders use to recognise when an uptrend may be losing strength. It forms when the price hits the same resistance level three times but fails to break through, suggesting strong selling pressure.
Recognised widely in technical analysis, this pattern helps traders spot potential market reversals and plan exits or short positions more confidently. In this blog, we’ll cover the definition, formation process, key characteristics, trading strategies, advantages, limitations, and comparisons with similar patterns so you have a clear framework for using the triple top in real trading.
Understanding the Triple Top Chart Pattern
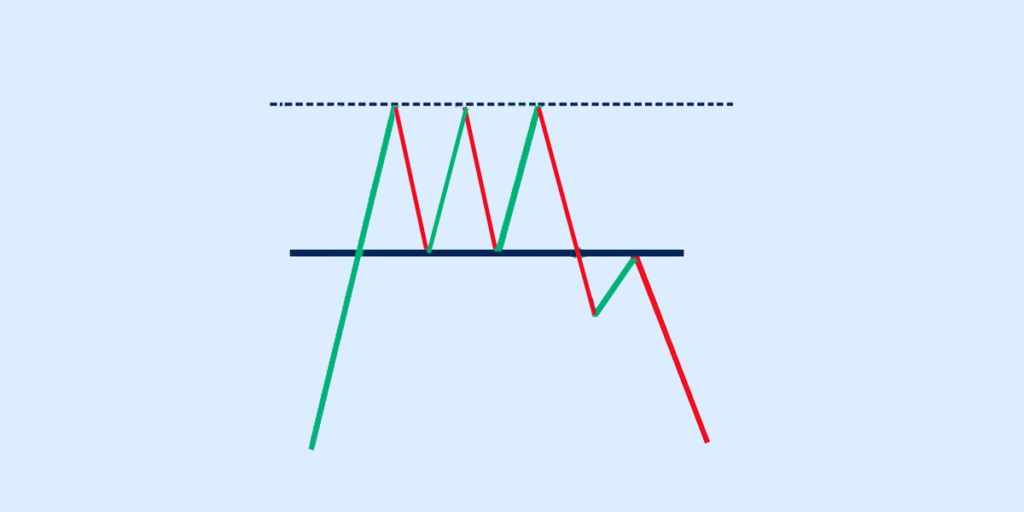
The triple top pattern is a bearish reversal formation that signals the possible end of an uptrend. It occurs when the price fails to break above the same resistance level on three separate occasions.
The formation process is simple: the market rallies up to a resistance zone, pulls back, tries again, and repeats the same behaviour three times. Each peak highlights that buyers are losing strength, while sellers are stepping in at the same level.
This recurring failure to move higher indicates weakening bullish momentum. Once the price eventually breaks below the support line (drawn at the lows between the peaks), it often confirms a shift from an uptrend to a potential downtrend.
Characteristics of the Triple Top Candle Pattern
The triple top candlestick pattern is a bearish reversal signal that forms after a prolonged uptrend. It reflects the market’s inability to break above a resistance level despite multiple attempts. Here are its key characteristics:
- Repeated rejection at resistance: The pattern is characterised by three peaks at nearly the same price level. Each peak shows that buyers attempted to push higher but were consistently rejected at the resistance zone.
- Volume behaviour during formation: Typically, volume is high during the first peak, then gradually decreases on the second and third attempts. This decline in volume suggests weakening buying pressure and a possible shift in momentum toward sellers.
- Breakdown below support as confirmation: The neckline (support level) forms at the lows between the peaks. A confirmed bearish signal occurs when the price breaks down below this support on strong volume, indicating that sellers have gained control.
Triple Top Pattern vs Other Chart Patterns
The triple top pattern is often compared with other bearish reversal formations because all of them point toward a potential shift from bullish to bearish sentiment. However, each pattern has its own characteristics, strengths, and reliability.
| Pattern | Key Structure | Market Signal | Strength Compared to Triple Top |
| Triple Top | Three peaks at nearly the same level with a flat neckline support | Strong bearish reversal after repeated failed attempts to break the resistance | Considered more reliable than single or double rejections because it shows prolonged resistance |
| Double Top | Two peaks at similar levels followed by a neckline breakdown | Bearish reversal, but can sometimes be less convincing due to fewer rejection points | Triple top is stronger since it confirms resistance with three clear failures |
| Head and Shoulders | One higher peak (head) between two smaller peaks (shoulders) with neckline support | One of the most widely recognised reversal patterns, a strong signal when the neckline breaks | Similar reliability to triple top, but differs in symmetry and structure |
In short, while the double top and head and shoulders are also trusted bearish patterns, the triple top candlestick pattern is valued for showing three strong rejection points, making it harder to dismiss as mere market noise.
How to Trade the Triple Top Chart Pattern
The triple top pattern is a bearish reversal signal, but trading it effectively requires discipline and confirmation. Here’s a structured approach:
1. Entry Strategy After Breakdown Confirmation
Wait for the price to break below the neckline (or the support level) that connects the lows between the three peaks. Ideally, look for a daily close below this neckline with increased volume.
Some conservative traders may wait for a retest of the neckline—previous support turning into resistance—before entering a short trade.
2. Setting Stop-Loss Levels
A common stop-loss placement is just above the last peak of the triple top candlestick pattern. This protects you from false breakdowns or sudden bullish reversals.
3. Measuring Price Targets
The target is typically calculated by measuring the height of the pattern: distance from the neckline to the peaks. Subtract this height from the breakdown level to set a realistic downside target.
4. Using Indicators for Validation
Some indicators that you can use to double-check your analysis are:
- Volume: Breakdown should ideally be accompanied by higher trading volume.
- RSI: Overbought levels followed by a bearish crossover strengthen the case.
- MACD or Moving Averages: Bearish crossovers can act as secondary confirmation before entry.
The triple top chart pattern works best when combined with other technical signals rather than used in isolation. Whether you invest in US stocks from India or trade Indian equities, recognising reversal patterns like the triple top can help you make better entry and exit decisions.
Advantages and Limitations of the Triple Top Pattern
Like all chart patterns, the triple top pattern has its strengths and weaknesses. These include:
Advantages
- Clear bearish reversal signal: When confirmed, the triple top chart pattern clearly indicates that buyers have failed to push past resistance multiple times.
- Widely recognised: Since the triple top candlestick pattern is well known among traders, it often triggers predictable market reactions once confirmed.
- Works across markets: Whether in stocks, forex, or crypto, the pattern reflects the same underlying psychology of buyers losing control.
Limitations
- False breakouts: The price might break below the neckline support, signaling an entry, only to reverse and move back up. This is known as a ‘bear trap’ and can lead to losses if a stop-loss is not in place.
- Need for confirmation: Traders must watch for volume spikes and breakdown below the neckline to confirm the triple top chart; without this, the signal may not hold.
- Takes longer to form: Since three peaks are needed, this pattern develops more slowly than a double top, which may delay trading decisions.
Real-Life Examples of Triple Top Charts
Here are some examples of triple top charts in use:
Stock Markets
Consider a stock that rallies to ₹1,000 multiple times over several weeks. Each time, it faces strong resistance and fails to break higher. After the third rejection, the stock falls below its key support level at ₹950 with rising volume, confirming the triple top chart pattern.
Traders who recognised this setup could have exited long positions early or planned a short trade after the breakdown.
Forex and Crypto Trading
In forex, suppose the EUR/USD pair hits 1.1200 three times but cannot sustain above it. The repeated failure signals weakening bullish momentum. Once the pair breaks below support at 1.1100, the triple top candlestick pattern confirms a bearish outlook.
Similarly, in crypto markets, Bitcoin has shown triple tops in the past; for example, rejecting the same resistance zone before entering a downtrend.
Lessons for Traders
These real-world cases highlight why the triple top chart is valuable:
- It warns of a possible trend reversal after prolonged bullish moves.
- It shows how resistance levels act as barriers when sellers step in.
- It reminds traders that volume confirmation is critical before acting.
Conclusion
The triple top chart pattern is one of the most reliable tools for spotting a weakening uptrend and preparing for a possible reversal. While it should always be confirmed with volume and other technical indicators, it remains a valuable signal for traders looking to manage risk and capture timely opportunities.
FAQs
What does the triple top pattern indicate in trading?
The triple top pattern indicates a potential bearish reversal. It forms when the price tests the same resistance level three times but fails to break through, suggesting that buying momentum is weakening and sellers may soon take control.
How reliable is the triple top candlestick pattern?
The triple top candlestick pattern can be reliable if confirmed with strong volume during the breakdown. However, like any chart pattern, it should not be used in isolation. Traders often combine it with indicators like RSI or MACD to reduce false signals.
What is the difference between a triple top and double top?
The key difference is the number of peaks. A double top shows two failed attempts at breaking resistance, while a triple top chart pattern has three peaks. A triple top is considered stronger evidence of resistance holding, but it also takes longer to form.
Can the triple top chart pattern appear in crypto trading?
Yes, the triple top chart can appear in any market, including crypto trading, forex, and stocks. Since the pattern reflects repeated failure to break resistance, it works across asset classes where technical analysis is applied.
How do traders confirm a triple top breakdown?
Traders confirm a triple top breakdown when the price falls below the neckline (support level connecting the lows between peaks) with high volume. Many traders wait for a daily close under this level before entering short positions to avoid false breakouts.
Disclaimer
The information provided in this article is for educational and informational purposes only. It should not be considered as financial or investment advice. Investing in stocks involves risk, and it is important to conduct your research and consult with a qualified financial advisor before making any investment decisions. The author and publisher are not responsible for any financial losses or gains that may result from the use of this information.


