
The symmetrical triangle pattern is a widely recognised formation in technical analysis that signals a period of consolidation before a potential breakout. It appears when the price of a stock, commodity, or index fluctuates between two converging trendlines: one sloping downward (resistance) and the other upward (support).
In this blog, we’ll cover the meaning and structure of the symmetrical triangle chart pattern, the different types (bullish and bearish), how to identify and trade it, and key signals to confirm a breakout.
Symmetrical Triangle Pattern – Meaning and Overview
A symmetrical triangle pattern is a technical chart pattern created when the price of a security creates a series of lower highs and higher lows, resulting in two converging trendlines. These trendlines meet at an apex and resemble a triangle.
The key characteristic of a symmetrical triangle is that neither the bulls nor the bears are in full control during its formation; it reflects a period of indecision or consolidation in the market.
Unlike ascending or descending triangles, symmetrical triangles are considered neutral patterns, meaning the breakout can happen in either direction — upward or downward. The direction of the breakout determines whether the trend will continue or reverse.
Why It Forms in the Market
A symmetrical triangle forms when:
- Buyers are pushing the price higher, but each time they succeed, sellers come in sooner than before (lower highs).
- Sellers are driving the price lower, but buyers keep stepping in earlier each time (higher lows).
- This back-and-forth reduces volatility and creates a compression in price, visible on the chart as a narrowing triangle.
This pattern usually appears during consolidation phases after a significant price movement. It reflects a tug-of-war between supply and demand, where neither side is strong enough to dominate until a breakout occurs.
In trending markets, symmetrical triangles are often seen as continuation patterns, meaning the price typically breaks out in the direction of the last trend. However, traders must wait for a breakout and volume confirmation before making decisions, as the pattern can lead to either a continuation or a reversal.
Importance of Technical Analysis
The symmetrical triangle pattern is important in technical analysis because:
- It helps traders anticipate a breakout: The breakout from a symmetrical triangle can lead to sharp price movements, giving traders potential entry and exit points.
- It reflects market psychology: The pattern shows how the market is balancing buyer and seller pressure, offering insights into market sentiment.
- It supports risk management: The clearly defined trendlines make it easier to place stop-loss orders just outside the triangle, helping manage risk during trades.
- It works across timeframes: Symmetrical triangle patterns can be applied to daily, weekly, or even intraday charts, making them relevant for short-term traders and long-term investors alike. Investors looking to invest in US stocks from India can also use this chart pattern while analysing US-listed companies, as technical analysis works across global markets.
Structure of the Symmetrical Triangle Chart Pattern
A symmetrical triangle chart pattern is defined by its unique structure, which reflects a narrowing price range due to buyer and seller indecision. Here’s a breakdown of its key elements:
Key Features: Converging Trendlines
The pattern is made up of two trendlines:
- Upper Trendline (Resistance): Slopes downwards, connecting a series of lower highs.
- Lower Trendline (Support): Slopes upwards, connecting a series of higher lows.
These lines converge at an apex, creating a symmetrical triangle shape. The price keeps getting squeezed between these lines, reducing volatility.
Price Movement Inside the Triangle
Within the triangle:
- Prices bounce between the two trendlines, forming a series of smaller swings.
- Each swing has lower highs and higher lows, indicating decreasing momentum in both directions.
- There is no clear directional bias until a breakout occurs, either upward or downward.
Duration and Volume Characteristics
- The pattern typically develops over a few weeks to several months, depending on the chart timeframe.
- As the triangle progresses, trading volume tends to decline, indicating reduced activity as the market awaits a breakout.
- A valid breakout is often accompanied by a sudden spike in volume, confirming the new trend direction.
Types of Symmetrical Triangle Patterns
While the symmetrical triangle pattern is neutral by design, its interpretation can be bullish or bearish depending on the preceding trend and breakout direction. Here’s a more detailed explanation of the types:
Bullish Symmetrical Triangle
A bullish symmetrical triangle typically forms during an uptrend. It shows temporary consolidation before the price resumes its upward movement.
- The pattern still has converging trendlines.
- A breakout above the upper resistance line confirms the bullish continuation.
- Volume generally increases at the breakout point, supporting the price surge.
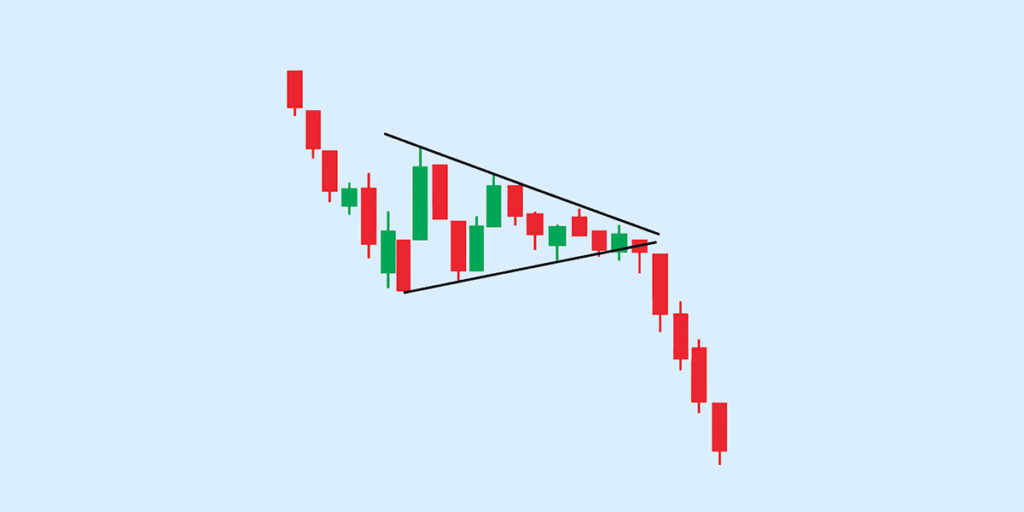
Bearish Symmetrical Triangle Pattern
A bearish symmetrical triangle pattern develops during a downtrend. It reflects short-term indecision before the price continues falling.
- Lower highs and higher lows still define the triangle.
- A breakdown below the support line signals a bearish continuation.
- As with bullish patterns, volume should increase on the breakdown to confirm the move.
How to Differentiate Between Them
The key difference lies in what came before and where the breakout happens:
- If the triangle forms after an uptrend and breaks out upwards, it’s bullish.
- If it forms after a downtrend and breaks downwards, it’s bearish.
- Always wait for a confirmed breakout with strong volume to determine the pattern’s direction; the shape alone doesn’t signal bias.
Symmetrical Triangle Pattern Breakout
A breakout from a symmetrical triangle pattern marks the end of the consolidation phase and the start of a new directional move. Here’s what you need to know:
What is a Breakout in This Pattern?
A symmetrical triangle pattern breakout occurs when the price moves decisively outside the triangle’s upper or lower trendline.
- A breakout above the resistance trendline suggests bullish momentum.
- A breakdown below the support trendline indicates bearish continuation.
The breakout is considered valid only when a clear price move and a rise in volume accompany it.
How to Identify Breakouts Accurately
To spot a genuine breakout:
- Watch for a strong candlestick closing outside the triangle.
- Check for volume confirmation—a noticeable spike in trading volume adds reliability to the move.
- Use technical indicators like RSI or MACD to confirm momentum in the breakout direction.
- Avoid reacting to the first minor move—wait for a clear close and follow-up movement.
Trading Strategies Post-Breakout
Once a breakout is confirmed:
- Enter the trade in the direction of the breakout—long for bullish breakouts, short for bearish ones.
- Place stop-loss orders just inside the opposite side of the triangle to limit risk.
- Use the height of the triangle (widest part) to estimate a price target — add/subtract this from the breakout point to project the potential move.
- Consider trailing your stop-loss to lock in profits as the price continues in your favour.
How to Trade Using the Symmetrical Triangle Pattern
Trading a symmetrical triangle pattern involves waiting for a confirmed breakout and managing your position with discipline. Here’s how you can approach it:
Entry and Exit Points
- Entry Point: Enter the trade only after a clear breakout, either above the resistance trendline (bullish) or below the support trendline (bearish). Wait for a candlestick close beyond the trendline, ideally supported by higher volume, to avoid false breakouts.
- Exit Target: Estimate the potential move by measuring the height of the triangle at its widest point and applying it from the breakout level. This gives you a projected price target.
Risk Management and Stop Loss
- Place your stop-loss just inside the triangle, opposite to the breakout side:
- For bullish trades, below the lower trendline
- For bearish trades, above the upper trendline
- This approach limits loss if the breakout turns out to be false.
- You can also use a trailing stop to protect profits as the price moves in your favour.
Combining with Other Indicators
To increase reliability and reduce false signals, combine the symmetrical triangle pattern with:
- Volume: A volume spike confirms the strength of the breakout.
- RSI (Relative Strength Index): Helps confirm momentum. Look for RSI moving out of overbought or oversold zones in the direction of the breakout.
- MACD (Moving Average Convergence Divergence): Confirms trend strength and can help spot divergences that support the breakout move.
How to Identify a Symmetrical Triangle Pattern Chart
To identify a symmetrical triangle pattern chart, you need to look for a specific visual structure that signals price consolidation with no clear directional bias, yet hints at an upcoming breakout. Here’s how you can recognise it:
1. Two Converging Trendlines
The upper trendline should connect a series of lower highs. Whereas, the lower trendline should connect a series of higher lows. Both lines slope toward each other, forming a triangle that narrows over time.
2. Price Movement Within the Triangle
Prices should bounce between these trendlines multiple times. Each swing becomes smaller, indicating a reduction in volatility. Also, there is no clear dominance between buyers or sellers during this phase.
3. Pattern Duration and Shape
The pattern usually forms over several weeks to a few months on daily or weekly charts. However, the triangle should look symmetrical, so avoid patterns that are too flat or one-sided, which might indicate a different formation.
4. Decreasing Volume
Volume tends to decline gradually as the pattern progresses, showing indecision. A sudden spike in volume near the apex can suggest an imminent breakout.
5. Preceding Trend
Although the pattern itself is neutral, identifying the prior trend helps predict the likely breakout direction—uptrend for bullish triangles, downtrend for bearish ones.
Conclusion
The symmetrical triangle pattern offers valuable insight into market behaviour during periods of price consolidation. Although neutral by nature, it becomes meaningful once the breakout direction is confirmed.
For traders and investors, understanding how this pattern forms, how to analyse it on charts, and how to plan trades around it can lead to better decision-making. When combined with volume and momentum indicators, this pattern becomes a practical tool for anticipating future price movements.
FAQs
What is the symmetrical triangle pattern in stock trading?
The symmetrical triangle pattern in stock trading is a chart formation formed by two converging trendlines—one sloping upward and the other downward—that create a narrowing price range. This pattern indicates consolidation in price action and suggests a potential breakout, but the direction of the breakout (upward or downward) determines whether the trend will continue or reverse. It is considered a neutral pattern.
How can I spot a bearish symmetrical triangle pattern?
You can spot a bearish symmetrical triangle pattern by identifying two converging trendlines where the lower trendline slopes downward. It usually forms during a downtrend and signals continuation if the price breaks below the support line. A valid breakdown typically happens with increased trading volume, confirming bearish momentum.
What signals confirm a symmetrical triangle pattern breakout?
What confirms a symmetrical triangle pattern breakout is a decisive price move beyond either the upper or lower trendline, ideally supported by a sharp rise in trading volume. A breakout above the resistance line suggests bullish continuation, while a breakdown below the support points to a bearish move. Volume confirmation helps distinguish genuine breakouts from false signals.
How long does a symmetrical triangle pattern typically last?
A symmetrical triangle pattern typically lasts anywhere from a few weeks to several months. The duration depends on the chart’s timeframe and the market conditions. The breakout usually occurs near the apex (where the trendlines meet), and longer formations often signal stronger breakouts once the pattern resolves.
Can symmetrical triangle patterns predict price reversals?
Symmetrical triangle patterns can sometimes predict price reversals, but they are primarily viewed as continuation patterns. When formed after a strong price move, they usually indicate the trend will resume post-breakout. However, if the market lacks momentum, a breakout in the opposite direction could suggest a reversal. The breakout direction ultimately determines the next trend.
Disclaimer
The information provided in this article is for educational and informational purposes only. It should not be considered as financial or investment advice. Investing in stocks involves risk, and it is important to conduct your own research and consult with a qualified financial advisor before making any investment decisions. The author and publisher are not responsible for any financial losses or gains that may result from the use of this information.


