
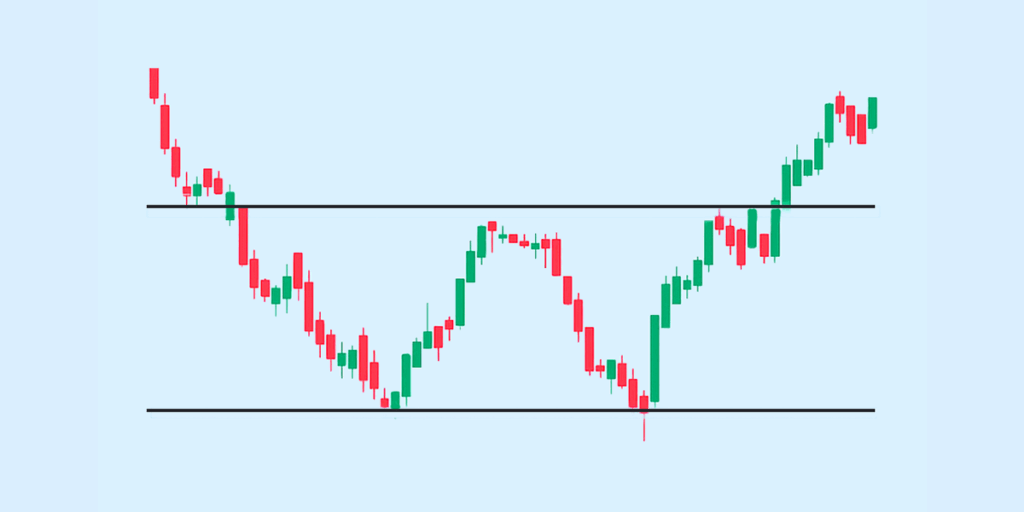
The double bottom chart pattern is among the most widely used reversal patterns in technical analysis. It signals the potential end of a downtrend and the start of a new uptrend. Visually, it forms a “W” shape on the chart, where the price hits a low, rebounds, retests that low, and then rises above a key resistance level known as the neckline.
In this blog, we’ll cover everything you need to know about the double bottom pattern, including its meaning and structure, how to identify and trade it, confirmation techniques, common mistakes, and how it compares with other reversal patterns like the double top.
Double Bottom Pattern – Meaning and Basics
A double bottom in technical analysis is a bullish reversal pattern that forms after a prolonged downtrend.
- It occurs when the price drops to a support level, rebounds, falls again to a similar level, and then rises.
- This creates two troughs (lows) near the same price, with a peak in between — resembling a “W” shape.
- The pattern completes once the price breaks above the peak between the two bottoms (known as the neckline).
How It Indicates a Bullish Reversal
The double bottom suggests that the market has tested the same support level twice without breaking lower—a sign that selling pressure is weakening.
- Buyers start gaining control after the second low, pushing the price higher.
- A breakout above the neckline confirms that the downtrend is over and a new uptrend may begin.
- This reversal signal helps traders identify potential buying opportunities early.
Why Traders Rely on This Pattern
Traders use the double bottom pattern because it provides a clear structure and timing for entry and risk management.
- It helps identify low-risk entry points near market bottoms.
- The breakout and neckline give defined targets and stop-loss levels.
- Along with indicators and volume, it adds confidence to a bullish reversal setup.
These same principles are also useful when you invest in US stocks from India, where timing entries in volatile global markets can improve returns
Structure of the Double Bottom Chart Pattern
The double bottom chart pattern has a distinct formation that signals a potential bullish reversal. To use it confidently, you need to understand its core elements, ideal conditions for reliability, and how it compares to similar reversal patterns.
Key Elements: Two Lows and a Neckline
The basic structure of a double bottom includes two troughs and a resistance level known as the neckline.
- The first low forms after a sustained downtrend, indicating strong selling pressure.
- The price rebounds from this level but fails to break out, facing resistance — this creates the neckline.
- The second low forms near the same level as the first, signalling that sellers are losing momentum.
- A breakout above the neckline confirms the pattern and suggests the start of a potential uptrend.
Timeframe and Volume Considerations
The reliability of the double bottom pattern improves based on the timeframe and volume activity.
- The pattern is more dependable on higher timeframes like daily or weekly charts; shorter timeframes often show false signals due to market noise.
- A higher volume breakout above the neckline adds strength to the reversal signal.
- If volume stays low during the breakout, the move might lack conviction and fail to sustain.
Double Bottom vs Other Reversal Patterns
It’s important to distinguish the double bottom from similar patterns to avoid confusion in your trading decisions.
- Unlike the head and shoulders bottom, which has three lows (with the middle one being deeper), the double bottom has only two equal or near-equal lows.
- Compared to a rounding bottom, which forms gradually, the double bottom is more defined and faster to complete.
- The double top and double bottom are opposites—the former signals a bearish reversal, while the latter indicates a bullish shift.
How to Identify the Double Bottom Pattern
The double bottom pattern is a bullish reversal signal that appears after a downtrend. It forms when the price hits a low, bounces back, falls to a similar low again, and then rises past a key resistance level (the neckline). This creates a “W” shape on the chart, but not every “W” is a valid double bottom. Here are some tips to trade it effectively:
Visual Clues on the Chart
Before assuming it’s a double bottom, make sure the pattern is clearly forming a “W” shape with the right spacing and structure.
- Look for two distinct troughs (bottoms) that form near the same price level.
- The space between the bottoms should show a noticeable rebound, creating the middle peak.
- The second bottom should not fall significantly lower than the first; slight variation is acceptable.
- The neckline connects the high point between the two bottoms — this is your breakout level.
Confirmation Signals Before Entry
Even if the visual pattern looks correct, you should wait for these technical confirmations before taking a trade.
- A breakout above the neckline is the most important confirmation of the double bottom pattern.
- A rise in volume during the breakout strengthens the signal — it indicates strong buyer interest.
- Use momentum indicators like RSI to check for bullish divergence or oversold conditions.
- Wait for a candle to close above the neckline before entering to avoid false breakouts.
Common Mistakes to Avoid
Many traders misread or rush into the double bottom setup — here’s what to avoid so you don’t get trapped.
- Entering before the neckline breakout—the pattern isn’t confirmed until this happens.
- Confusing a temporary pullback with a true double bottom — both troughs must be clear and well-formed.
- Ignoring volume or indicators—they help filter out weak or failed patterns.
- Using the pattern on very short timeframes, where market noise can create misleading setups.
How to Trade the Double Bottom Pattern
Trading the double bottom chart pattern is about timing your entry right, managing risk smartly, and using confirmation tools. Here’s how to approach it with clarity and structure.
- Start by identifying a clean “W” shape on the chart. The key level to watch is the neckline — the high point between the two lows.
- Your entry point comes after the price breaks above this neckline.
- Wait for a candle to close above it, ideally on strong volume. This confirms the bullish breakout and reduces the risk of a false signal.
- Once the breakout is confirmed, focus on risk management. Place your stop-loss slightly below the second bottom. This gives the trade room to breathe and protects you if the reversal fails.
- For your target, use the height of the pattern—the distance between the neckline and the lowest point.
- Project that same distance upward from the neckline breakout to set a realistic profit goal.
To boost confidence in the trade, combine the pattern with technical indicators:
- RSI can highlight oversold conditions or show bullish divergence around the second low.
- MACD is useful for spotting bullish crossovers near the breakout zone.
- Volume should increase as the price breaks the neckline — this confirms strong buyer interest.
Double Top vs Double Bottom Pattern
In technical analysis, both double top and double bottom chart patterns are widely used to spot potential trend reversals. While they look visually opposite, they serve the same purpose — helping traders decide when a trend might be about to shift.
Here’s a comparison between double top and double bottom chart patterns to help you see when and how each should be used:
| Feature | Double Top Pattern | Double Bottom Pattern |
| Pattern Shape | “M” shaped | “W” shaped |
| Trend Direction Before Formation | Uptrend | Downtrend |
| Reversal Indication | Bearish reversal (uptrend to downtrend) | Bullish reversal (downtrend to uptrend) |
| Support/Resistance Role | Forms resistance at the top | Forms support at the bottom |
| Breakout Confirmation | Price breaks below the neckline (support) | Price breaks above the neckline (resistance) |
| Volume Pattern | Volume may decline during the second peak | Volume may rise on the second bottom |
| Trader Bias | Look to sell or short | Look to buy or go long |
| Risk Management Tip | Use stop-loss above the second top | Use stop-loss below the second bottom |
When to Use Each in Trading Decisions
Use the double top pattern when you’re trading an overextended rally and expect a pullback or trend reversal. It’s ideal for timing exits or short positions.
Use the double bottom pattern when the asset has been falling but shows signs of stabilising and reversing. It helps in identifying buying opportunities during trend reversals.
Both double tops and double bottoms chart patterns become more reliable when confirmed by indicators like RSI, MACD, or volume spikes at breakout points. Always combine pattern analysis with broader market context before making a trade.
Wrapping Up
The double bottom pattern is a powerful indicator of bullish reversal when used correctly. It offers a clear framework for entry, stop-loss, and profit-taking, especially when supported by volume and technical indicators like RSI and MACD. However, like any chart pattern, it should never be used in isolation. The key is to wait for confirmation and avoid impulsive trades based on incomplete setups.
FAQs
What is a double bottom chart pattern?
A double bottom chart pattern is a bullish reversal pattern that shows the end of a downtrend and the start of an uptrend. It forms a “W” shape when the price hits a support level twice, rebounds both times, and breaks above the neckline (resistance), indicating a potential buying opportunity.
How do I know if it’s a true double bottom or a false signal?
You know it’s a true double bottom when the price breaks above the neckline after forming two clear lows at similar levels. A false signal occurs if the price fails to cross the neckline and continues to move sideways or downward, making the pattern unreliable.
What’s the difference between a double top and a double bottom?
The difference between a double top and a double bottom lies in trend direction. A double top is a bearish reversal pattern that forms an “M” shape and signals a move from an uptrend to a downtrend. In contrast, a double bottom is a bullish reversal pattern shaped like a “W”, indicating a shift from downtrend to uptrend. Both are part of double top and double bottom chart patterns used in technical analysis.
Is the double bottom pattern suitable for intraday trading?
Yes, the double bottom pattern is suitable for intraday trading, but it’s more reliable on higher timeframes. In intraday charts, price noise may lead to false signals. So, it’s important to confirm the pattern with volume or technical indicators before taking positions.
Which indicators work best with the double bottom pattern?
Indicators that work best with the double bottom pattern include the Relative Strength Index (RSI) for identifying oversold zones, Moving Averages for trend confirmation, and Volume analysis to confirm breakout strength. These tools help validate double bottoms and bottom chart patterns before entering a trade.
Disclaimer
The information provided in this article is for educational and informational purposes only. It should not be considered as financial or investment advice. Investing in stocks involves risk, and it is important to conduct your own research and consult with a qualified financial advisor before making


