
Quick Summary:
- The Morning Star Candlestick Pattern is a bullish reversal pattern that signals a possible price trend change from down to up in stock or forex markets.
- The pattern consists of three price candlesticks: first a long bearish candlestick, then a small-bodied candlestick (which can either be bullish or bearish), and lastly a long bullish candlestick that closes above the midpoint of the long bearish candlestick.
- Traders often utilize the Morning Star to predict a market rebound and find entry for buying opportunities.
- The significance of the pattern increases when it follows a prolonged downtrend, demonstrating potential for a price reversal.
- Traders will use the Morning Star to enter long on a trade and take advantage of the upward trend, while placing stop-loss orders just below the low of the Morning Star pattern.
The Morning Star candlestick pattern is used by traders to recognise potential turning points in a falling market. It doesn’t just signal a pause in a downtrend—it suggests that buyers may be stepping in with strength.
This pattern is part of Japanese candlestick charting techniques and is often seen near support levels or after extended bearish phases. Read along to know more!
Morning Star Candlestick – Meaning and Importance
The Morning Star pattern is a three-candle form that shows a potential reversal from a bearish to bullish trend. It consists of:
- A long bearish candle, showing strong selling momentum.
- A small-bodied candle (bullish, bearish, or a doji), reflecting market indecision.
- A long bullish candle that closes above the midpoint of the first candle, indicating that buyers are regaining control.
Why It Matters in Technical Analysis
The Morning Star pattern is important because:
- It marks potential trend reversals: Traders use it to identify where a downtrend may be ending and an uptrend might begin.
- It helps in spotting buying opportunities: When confirmed by indicators like RSI or volume, it offers a high-probability setup for entering long positions. Similar chart-based analysis is used by investors who invest in US stocks from India to identify potential entry points in global markets.
- It reflects changing sentiment: The pattern visualises a shift from bearish dominance to bullish interest, which is a key behavioural signal in price action analysis.
Structure of the Morning Star Pattern
The Morning Star candlestick pattern has three distinct candles that together signal a potential bullish reversal. Each candle in the sequence plays a specific role in indicating a shift in market sentiment from bearish to bullish. Here’s how:
First Candle: Bearish Continuation
- This is a long red (bearish) candle.
- It reflects strong selling pressure and continues the existing downtrend.
- It sets the stage by showing clear market pessimism and dominance by sellers.
Second Candle: Indecision (Doji or Small Body)
- This is a small-bodied candle, which can be bullish, bearish, or a doji.
- It represents market indecision, as neither buyers nor sellers take full control.
- Often forms a gap down from the first candle, though this is less common in markets like forex.
Third Candle: Strong Bullish Reversal
- This is a long green (bullish) candle that closes well into the body of the first bearish candle—ideally beyond its midpoint.
- It confirms that buyers have taken control, indicating a likely reversal of the downtrend.
- The volume may increase here, reinforcing the strength of the reversal.
When all three components align, the Morning Star pattern signals that the downtrend may be ending and a bullish phase could begin. For higher accuracy, use this pattern alongside volume analysis and indicators like RSI or MACD.
Morning Star Pattern on Charts
The Morning Star chart pattern is a visual cue for traders to identify potential bullish reversals. To trade it effectively, you must understand how it appears on charts, the conditions that strengthen its reliability, and how volume supports the reversal signal.
Morning Star Chart Pattern Example
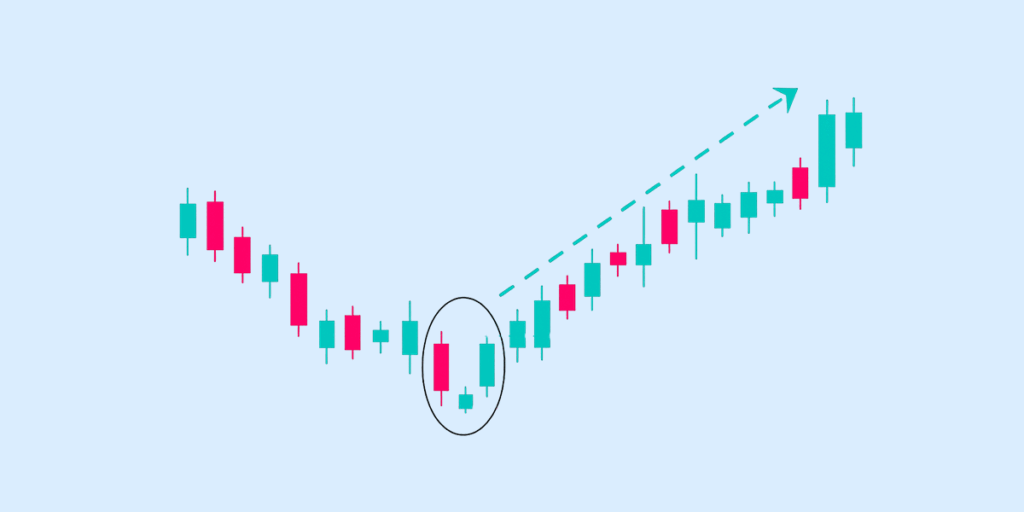
The Morning Star pattern, on a price chart, appears after a downtrend as three candles in sequence:
- First Candle: Long red candle showing continued selling.
- Second Candle: Small-bodied candle (can be red, green, or a doji) indicating indecision.
- Third Candle: Long green candle that closes above the midpoint of the first red candle, confirming buying pressure.
For example, a daily chart of a stock like Apple (AAPL) or Reliance, if you spot this three-candle setup at a recent swing low, it often signals a reversal and a buying opportunity.
Ideal Conditions for Morning Star Formation
Some ideal conditions for the Morning Star formation are:
- Preceding Downtrend: The pattern must form after a clear decline in price.
- Support Zone: The pattern is more reliable if it appears near a technical support level or a previous low.
- Low Volatility in Second Candle: The middle candle should show indecision; a spinning top or doji is ideal.
- Strong Close on Third Candle: The third candle must close above the midpoint of the first candle’s body to confirm reversal strength.
Volume Analysis During the Pattern
Here’s what the different candles on the Morning Star pattern indicate:
- First Candle: High or rising volume often reflects panic selling or heavy bearish pressure.
- Second Candle: Volume typically drops, showing indecision and a pause in the trend.
- Third Candle: A spike in volume confirms bullish strength and validates the reversal. Strong volume here is a key sign that buyers are stepping in with conviction.
How to Trade Using the Morning Star Pattern
The Morning Star pattern is a bullish reversal signal that helps traders spot potential buying opportunities after a downtrend. To use it effectively, combine candlestick analysis with entry rules, proper risk management, and indicator confirmation. Here’s how:
Entry and Exit Strategies
- Entry Point: Enter a long (buy) trade after the third candle of the Morning Star pattern closes above the midpoint of the first bearish candle. This signals that buyers have regained control.
- Ideal Timeframe: The pattern is more reliable on daily or 4-hour charts, where market noise is reduced.
- Exit Strategy: Exit when the price approaches a known resistance level, or use a trailing stop-loss to ride a longer uptrend.
Stop-Loss and Target Setting
- Stop-Loss Placement: Set the stop-loss just below the low of the second (small-bodied) or third candle to limit downside risk.
- Target Setting:
- Short-Term Target: Set a target based on recent resistance levels or a 1:2 risk-reward ratio.
- Advanced Targeting: Use Fibonacci retracement levels or moving averages (like the 50-day EMA) as dynamic targets.
Confirmation with Indicators (RSI, Moving Averages)
- RSI (Relative Strength Index): A bullish signal is stronger if the RSI rises from oversold levels (below 30) after the pattern forms.
- Moving Averages: Look for price closing above the 20-day or 50-day moving average, indicating a potential trend reversal.
- Volume Confirmation: Increased volume on the third candle adds weight to the pattern, showing strong buying interest.
Difference Between Morning Star and Evening Star Patterns
While the Morning Star candlestick pattern signals a bullish reversal at the bottom of a downtrend, the Evening Star candlestick pattern signals a bearish reversal at the top of an uptrend. Both patterns feature a central candle indicating market indecision (typically a Doji or small-bodied candle), but their context and implications differ sharply.
Below is a comprehensive comparison:
| Aspect | Morning Star Candlestick Pattern | Evening Star Candlestick Pattern |
| Type of Pattern | Bullish reversal pattern | Bearish reversal pattern |
| Trend Location | Appears at the bottom of a downtrend | Appears at the top of an uptrend |
| First Candle | A long bearish candle indicating seller dominance | Long bullish candle indicating buyer strength |
| Second Candle | Small-bodied candle (bullish/bearish/doji) showing indecision | Small-bodied candle (bullish/bearish/doji) showing indecision |
| Third Candle | Long bullish candle closing above the midpoint of the first candle | Long bearish candle closing below the midpoint of the first candle |
| Market Sentiment Shift | Indicates buyers are gaining control | Indicates sellers are gaining control |
| Trading Implication | Suggests a potential long (buy) entry | Suggests a potential short (sell) entry |
| Confirmation Signals | Volume rise, RSI crossover, MACD bullish crossover | Volume rise, RSI drop, MACD bearish crossover |
| Common Support/Resistance Role | Often forms near strong support levels | Often forms near strong resistance levels |
| Pattern Reliability | Considered reliable when confirmed with indicators | Considered reliable when confirmed with indicators |
Wrapping Up
In conclusion, the Morning Star pattern is a reliable visual cue for a potential shift from bearish to bullish momentum. While it’s a powerful indicator on its own, it works best when confirmed with technical indicators like RSI, MACD, or volume. Traders often use it to spot reversal zones and make strategic long entries at the start of an uptrend.
FAQs
What is a Morning Star candlestick pattern?
A Morning Star candlestick pattern is a bullish reversal pattern that shows a potential shift from a downtrend to an uptrend. It compromises of three candles: a long bearish candle, a small-bodied candle (indecision), and a long bullish candle. This pattern reflects a selling pressure is weakening and buyers are gaining strength.
How can I identify a Morning Star pattern on a chart?
You can identify a Morning Star pattern on a chart by spotting three specific candles during a downtrend:
- A large red (bearish) candle.
- A small-bodied candle (red or green), showing indecision.
- A large green (bullish) candle that closes above the midpoint of the first red candle.
This combination signals a shift in momentum from sellers to buyers.
Is the Morning Star pattern reliable for stock trading?
The Morning Star pattern is generally reliable for stock trading as a bullish reversal signal. However, it is best used alongside other technical indicators like RSI, MACD, or support zones to improve accuracy and avoid false signals.
What indicators can confirm a Morning Star signal?
Indicators that can confirm a Morning Star candlestick pattern include:
- RSI (Relative Strength Index) is turning upward from oversold levels.
- MACD (Moving Average Convergence Divergence) showing a bullish crossover.
- Volume increases on the third candle.
- A close above the midpoint of the first candle in the pattern.
What is the difference between the Morning Star and Evening Star patterns?
The difference between the Morning Star and Evening Star patterns lies in trend direction and trading signal. The Morning Star pattern appears at the end of a downtrend and signals a potential bullish reversal. In contrast, the Evening Star pattern forms at the end of an uptrend and signals a possible bearish reversal.
Disclaimer
The information provided in this article is for educational and informational purposes only. It should not be considered as financial or investment advice. Investing in stocks involves risk, and it is important to conduct your own research and consult with a qualified financial advisor before making any investment decisions. The author and publisher are not responsible for any financial losses or gains that may result from the use of this information.


