
A bear flag pattern is a widely recognised chart formation that signals the continuation of a downtrend. It appears after a sharp price decline, followed by a short-lived upward or sideways consolidation that resembles a small flag on a pole.
Once this pause ends, prices often break down again, extending the bearish move. Traders and analysts consider the bear flag pattern important because it helps in identifying opportunities to align trades with the prevailing market trend. Continue reading to know more.
Understanding the Bear Flag Trading Pattern
The bear flag chart pattern forms when a short-lived upward or sideways consolidation follows a steep price decline. Once this pause is over, the price typically resumes its downward movement.
Key Components
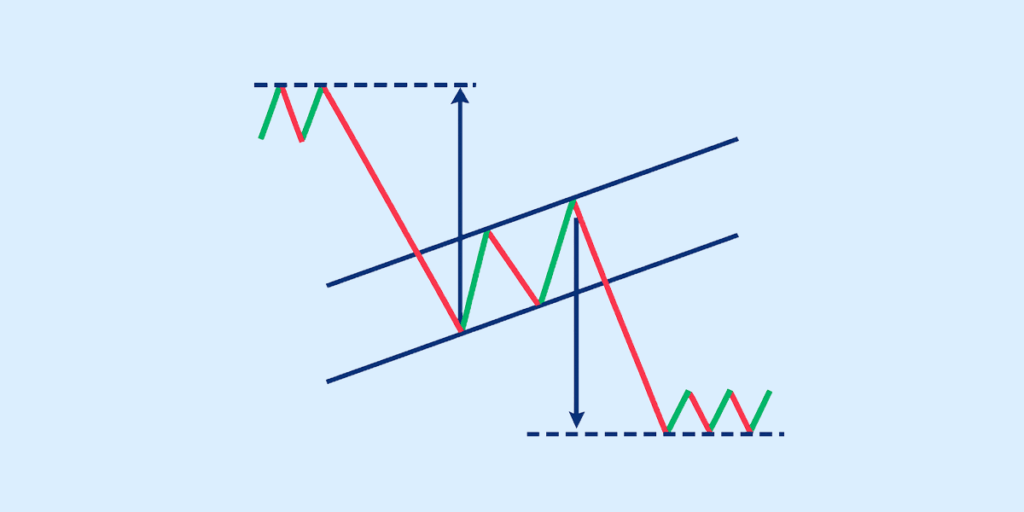
- Flagpole: A sharp and aggressive downward move, usually with high trading volume.
- Consolidation Channel (Flag): A temporary sideways or slightly upward trend, marked by weaker volume, that resembles a flag on a pole.
- Breakdown: A decisive move below the lower boundary of the consolidation channel, ideally on strong volume, confirming continuation of the downtrend.
This flag bearish pattern reflects a market where sellers dominate. The initial drop shows strong selling pressure, the consolidation shows a brief pause and the breakdown suggests that bearish momentum is ready to continue.
Bear Flag Pattern vs Other Chart Patterns
The bear flag trading pattern is often grouped with other continuation setups, but it carries unique traits. To understand it better, let’s compare it with similar patterns:
| Pattern | Direction | Structure | Key Signal |
| Bear Flag | Bearish (downtrend) | Sharp drop (flagpole) + small upward channel | Breakout below consolidation confirms sell signal |
| Bull Flag | Bullish (uptrend) | Sharp rise (flagpole) + small downward/sideways channel | Breakout above consolidation confirms buy signal |
| Pennant | Can be bullish or bearish | Sharp move + triangular consolidation | Breakout in the same direction as the prior move |
The bear flag chart pattern fits under the broader flag bearish pattern category. It signals that sellers remain dominant and that the downtrend is likely to continue after a very short pause.
Characteristics of a Bear Flag Chart Pattern
To recognise a valid bear flag trading pattern, traders usually look for a set of clear signals:
- Sharp Downward Move (Flagpole): The pattern begins with a steep decline in price which forms the “flagpole,” showing a strong selling pressure in the market.
- Short Upward Consolidation (Flag): After the drop, prices move sideways or slightly upward in a tight channel. This temporary pause shows a weak buying phase before sellers get back control.
- Breakout to the Downside: The real confirmation comes when the price breaks below the lower boundary of the flag which signals that the downtrend is likely to resume.
- Volume Confirmation During Breakdown: Strong volume on the breakout adds credibility to the bear flag chart pattern which indicates that sellers are back in control. Similar technical patterns are also used by investors who invest in US stocks from India, as chart analysis follows the same principles across global equity markets.
How to Trade the Bear Flag Pattern
Here’s how traders typically use the bear flag trading pattern:
1. Identifying Entry Points
Once the price breaks below the lower boundary of the consolidation channel (the flag), traders often think of this the entry signal for a short position. More conservative traders may wait for a candle to close below this level to avoid false breakdowns.
2. Stop-Loss Placement
A stop-loss is usually set just above the upper resistance line of the flag. This protects against sudden reversals that could invalidate the bear flag chart pattern.
3. Profit Target Measurement
The target price is generally estimated by measuring the length of the preceding flagpole—the sharp downward move—and projecting the same distance downward from the breakout point. This helps traders set realistic exit levels.
4. Using Volume and Indicators for Confirmation
Volume is an important element in validating the bear flag trading pattern. Ideally, the initial drop (flagpole) should come with strong volume which is followed by lower volume during consolidation and then another spike in volume on the breakdown.
Traders often combine this with indicators (like RSI or MACD) to confirm bearish momentum.
Advantages and Limitations of Bear Flag Patterns
The bear flag trading pattern comes with strengths and weaknesses, like any other technical setup.:
Advantages
Some pros of bear flag patterns are:
- Clear Continuation Signal: The bear flag chart pattern often confirms an existing downtrend, making it easier for traders to align their positions with the prevailing market direction.
- Simple to Identify: With its flagpole and rectangular consolidation phase, the flag bearish pattern is relatively straightforward to spot on charts compared to more complex setups.
- Works Across Markets: From stocks and forex to crypto, the bear flag trading pattern is widely recognised and applied.
Limitations
While it has its benefits, some cons of this pattern are:
- False Breakouts: Not every flag results in a breakdown. Sometimes, the price consolidates and reverses upward, trapping traders who entered too early.
- Reliance on Volume: A valid bear flag chart requires high volume during the initial drop and again during the breakdown. Without this, the pattern may fail.
- Short-Term Nature: The bear flag candlestick pattern typically signals short-term continuation which makes it less effective for long-term investing decisions.
Real-World Examples of Bear Flag Charts
Here are some practical examples that highlight how it plays out in different markets:
1. Stock Markets
Bear flags often emerge during market corrections or sector-wide selloffs. For instance, in early 2023, Tesla’s stock experienced a sharp decline followed by a short consolidation phase that clearly formed a bear flag before it resumes the downward trend.
2. Cryptocurrency Trading
In highly volatile assets like Bitcoin and Ethereum, the bear flag chart pattern shows up regularly. For example, in 2022, when Ethereum’s price fell from around $2,000 to $1,500, consolidated for a short period, and then broke lower around $1,200.
3. Forex Markets
The bear flag pattern also applies to currency pairs, often triggered by macroeconomic data or central bank announcements. For example, EUR/USD once declined sharply from 1.20 to 1.15, consolidated near 1.1 and then continued its bearish move down to 1.12.
Conclusion
The bear flag pattern is simple yet beneficial which offers traders a clear view of bearish continuation in the market. By spotting its structure—flagpole, consolidation, and breakdown—traders can position themselves better in trending markets and avoid countertrend mistakes.
FAQs
What does the bear flag chart pattern indicate?
The bear flag chart pattern indicates a continuation of a downtrend. It shows a sharp price drop (the flagpole), followed by a brief upward or sideways consolidation (the flag), before the price breaks down further. This makes the bear flag trading pattern a bearish continuation signal.
How do you identify a bear flag trading pattern?
You can identify a bear flag trading pattern by spotting three elements:
- A steep price decline (flagpole)
- A short consolidation phase, often upward-sloping or sideways (the flag)
- A breakdown below the flag’s support line, confirming continuation of the downtrend.
What is the difference between a bear flag and a pennant?
The main difference between a bear flag and a pennant lies in the consolidation phase. A flag bearish pattern forms a rectangular channel with parallel trendlines, while a pennant forms converging trendlines, creating a small triangle shape. Both, however, are continuation patterns.
Is the bear flag pattern reliable in stock trading?
The bear flag pattern is considered reliable when confirmed with volume. A strong sell-off on high volume during the flagpole and renewed selling pressure during the breakdown make the pattern more credible. Traders often pair it with other indicators to reduce false signals.
Can the bear flag chart pattern be used in forex and crypto?
Yes, the bear flag chart can be applied across markets, including forex and crypto. Since it reflects market psychology during downtrends, it works on different asset classes where technical analysis is relevant.
Disclaimer
The information provided in this article is for educational and informational purposes only. It should not be considered as financial or investment advice. Investing in stocks involves risk, and it is important to conduct your research and consult with a qualified financial advisor before making any investment decisions. The author and publisher are not responsible for any financial losses or gains that may result from the use of this information.


