
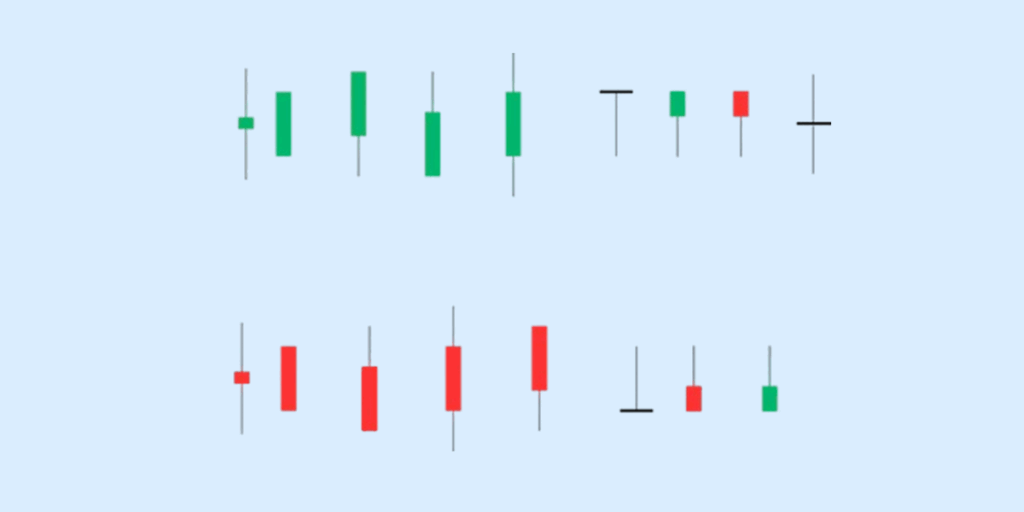
In technical analysis, a single candlestick pattern is formed from just one candle on the price chart. Despite its simplicity, it can offer valuable insights into market sentiment. These patterns show the battle between buyers and sellers within one trading session and often act as signals for potential trend reversals or continuations.
Some of the most widely used single candlestick patterns include the hammer candlestick, inverted hammer candlestick, and doji candlestick. Each provides a snapshot of momentum shifts, making them especially useful for short-term traders looking to time entries and exits.
Keep reading to know more!
Understanding Single Candlestick Patterns
A single candlestick pattern is a chart formation that uses just one candle to provide insights into price movement. Unlike multi-candle patterns, these are compact and easy to spot, yet they still capture a wealth of information about market sentiment in a single trading session.
These patterns reflect market psychology: the constant tug-of-war between buyers and sellers. For example, a hammer candlestick shows that buyers were able to push prices back up after a session of selling pressure, while a doji candlestick indicates indecision in the market. By analysing the shape and position of the candle, traders can get a sense of who holds the upper hand.
The main role of single candlestick patterns is in predicting short-term price movements. While they may not always signal major trend changes on their own, they can highlight possible reversals or continuations when combined with volume, support, and resistance levels. For this reason, many traders rely on them for quick entry and exit decisions.
Key Types of Single Candlestick Patterns
Single candlestick patterns are powerful tools in technical analysis, offering quick insights into market sentiment. Some of the most common and widely used types are:
Hammer Candlestick
A hammer candlestick forms after a decline and is seen as a potential bullish reversal indicator. It has a small body, little to no upper shadow, and a long lower shadow. This shows that sellers drove the price down during the session, but buyers regained control by the close.
Inverted Hammer Candlestick
The inverted hammer candlestick also suggests a reversal, appearing after a downtrend. It features a small body, a long upper shadow, and little to no lower shadow. The long wick signals buying interest, even if the session closed lower, hinting that buyers may be preparing for a comeback.
Doji Candlestick
A doji candlestick forms when the open and close prices are nearly the same. It represents market indecision, where neither buyers nor sellers dominate. Depending on its position in a trend, a doji can signal a potential reversal or a continuation.
Spinning Top & Other Variants
A spinning top has a small body with long upper and lower shadows. Like the doji, it reflects uncertainty in the market. While it doesn’t give a strong directional signal, it often warns traders to wait for confirmation before making moves.
Hammer Candlestick and Bullish Trading Signals
The hammer candlestick is one of the most popular single candlestick patterns in technical analysis. It is considered a bullish reversal signal, especially when it appears after a strong downtrend. Traders value it because it reflects a shift in market sentiment from selling pressure to buying interest.
Structure of a Hammer Candlestick
- Small real body located near the top of the candle.
- Long lower shadow at least double the size of the body.
- Little to no upper shadow.
This structure shows that sellers pushed prices lower during the session, but buyers regained control and managed to close near the open.
How Traders Use It for Bullish Setups
A candlestick hammer bullish signal often indicates that the downtrend may be losing strength. Traders look for it near support levels or oversold conditions to time potential long entries.
- A single hammer candlestick is not enough; confirmation with the next candle closing higher and on stronger volume is preferred.
- Works best when paired with other indicators like RSI or MACD for added conviction.
Entry, Stop-Loss, and Profit Target Examples
- Entry Point: Traders usually enter long when the price moves above the hammer’s high in the next session.
- Stop-Loss: Placed just below the hammer’s low to minimise downside risk.
- Profit Target: Often set at the next resistance level, or calculated using risk-reward ratios (e.g., 1:2 or 1:3).
For example, if a stock forms a hammer candlestick at ₹100, with a low at ₹95 and high at ₹102, traders may enter above ₹102, place a stop-loss below ₹95, and target ₹110–₹115 depending on the setup.
Inverted Hammer Candlestick Explained
The inverted hammer candlestick is a single candlestick pattern that signals a potential reversal after a downtrend. Unlike the hammer candlestick, which has a long lower shadow, the inverted hammer has a long upper shadow and a small body near the session’s low.
The pattern typically shows up after a sustained decline. It suggests that although sellers pushed prices down, buyers tried to lift the price higher, hinting at a possible reversal.
Difference from a Hammer
A Hammer candlestick has a long lower shadow, showing that buyers stepped in after selling pressure. In contrast, an inverted hammer candlestick has a long upper shadow, which reflects buying attempts despite overall weakness.
Confirmation Needed
A single candle is not enough. Traders usually wait for a bullish candle in the following session with higher volume to confirm the signal. Without confirmation, the inverted hammer candlestick can result in false signals.
H2: Doji Candlestick and Market Indecision
A doji candlestick forms when the opening and closing prices are almost the same, resulting in a very small or no body. It is widely seen as a symbol of market indecision: buyers and sellers are not in control.
The doji candlestick is important because it highlights a pause in trend momentum. Depending on its placement (after a strong uptrend or downtrend), it may warn of a potential reversal.
Types of Doji Candlesticks
- Standard Doji: Open and close at nearly the same level, with short shadows.
- Long-Legged Doji: Long upper and lower wicks, showing extreme indecision.
- Gravestone Doji: Long upper shadow with little or no lower shadow, hinting at bearish pressure.
- Dragonfly Doji: Long lower shadow with little or no upper shadow, often seen as bullish.
Moreover, dojis are common, especially in volatile markets. Traders often combine them with other tools like support/resistance levels, RSI, or MACD before taking action.
How to Trade Single Candlestick Patterns
Trading single candlestick patterns like the hammer candlestick, inverted hammer candlestick, and doji candlestick requires discipline and supporting signals. Acting on them in isolation can often lead to mistakes. Here’s what to do instead:
1. Importance of Confirmation
Always wait for confirmation from the next candle or two. For example, a hammer candlestick bullish setup becomes more reliable if the following candle closes higher, confirming buyer strength.
2. Role of Volume and Support/Resistance Levels
Volume adds weight to the pattern. A doji candlestick forming at a strong support or resistance zone, backed by noticeable volume, carries more significance than one forming in the middle of a range.
3. Risk Management Strategies
Place stop-loss orders carefully to manage risk. For instance, when trading a hammer or inverted hammer, stops are often placed just below the candle’s low. This protects traders if the reversal fails and the price continues in the previous direction.
Limitations of Single Candlestick Patterns
While single candlestick patterns like the hammer candlestick, inverted hammer candlestick, and doji candlestick provide useful signals, they also have certain drawbacks that traders must keep in mind.
- Reliability Issues Without Confirmation: A single candlestick pattern on its own is not always dependable. Traders need to wait for confirmation from subsequent candles or volume before acting.
- Misinterpretation in Volatile Markets: In highly volatile sessions, these patterns can appear frequently but may not indicate genuine reversals, leading to false signals.
- Works Best with Other Technical Indicators: Single candlestick patterns should be combined with tools like RSI, MACD, or Moving Averages for stronger validation and better decision-making. This approach is equally valuable for traders learning how to invest in US stocks from India, where combining multiple technical indicators can improve trading decisions in international markets.
Conclusion
Single candlestick patterns may look small, but they play a big role in helping traders spot market turning points. When used with other tools like support and resistance or volume analysis, they can become powerful guides for trading decisions.
FAQs
What is a single candlestick pattern in trading?
A single candlestick pattern is formed using just one candle on a price chart. It gives traders quick insights into market sentiment for that specific session. Examples include the hammer candlestick, inverted hammer candlestick, and doji candlestick.
Is hammer candlestick pattern bullish or bearish?
The hammer candlestick is generally considered bullish. It appears after a downtrend and signals that buyers are stepping in, potentially reversing the trend upward. Traders often call it a candlestick hammer bullish setup.
How reliable is the inverted hammer candlestick?
The inverted hammer candlestick suggests a possible bullish reversal, but by itself, it isn’t always reliable. Traders usually confirm it with volume and the next few candles before entering a trade.
What does a Doji candlestick tell traders?
A doji candlestick shows indecision in the market. The open and close prices are almost the same, showing that neither buyers nor sellers had control. It can signal potential reversals when it appears after strong trends.
Can single candlestick patterns predict reversals accurately?
Single candlestick patterns can highlight important market signals, but they are not foolproof. For better accuracy, traders combine them with support-resistance levels, volume, and other technical indicators.
Disclaimer
The information provided in this article is for educational and informational purposes only. It should not be considered as financial or investment advice. Investing in stocks involves risk, and it is important to conduct your research and consult with a qualified financial advisor before making any investment decisions. The author and publisher are not responsible for any financial losses or gains that may result from the use of this information.


