
The Fear and Greed Index (FGI) is a key tool to gauge the market’s mood, helping investors understand the collective sentiment driving market trends. The FGI provides valuable insights into potential market movements by analysing how fear or greed influences decision-making.
Additionally, monitoring the market mood index can help you identify whether the market is overly optimistic (greed) or overly pessimistic (fear), helping you spot potential opportunities or risks.
What is the Fear and Greed Index?
The Fear and Greed Index (FGI) is a tool designed to assess the emotional state of the stock market. It provides insights into how market sentiment can influence trading behaviour. The index helps investors understand whether the market is overly cautious or optimistic by measuring the balance between fear-driven selling and greed-driven buying.
Definition and Purpose
The Fear and Greed Index aims to capture the psychological factors affecting market participants. When fear dominates, the market may be undervalued, presenting buying opportunities. On the other hand, excessive greed can indicate overvaluation, potentially signalling the need to sell. The index is essential for identifying trends and potential market corrections by tracking market sentiment.
Components of the Fear and Greed Index
The primary components of FGI are:
- Market Volatility is assessed through the VIX (Volatility Index), which measures the level of market fear based on stock options prices. A high VIX indicates higher market fear and volatility, while a low VIX suggests stability and confidence.
- Stock Price Momentum: This tracks the stock market’s 125-day moving average, helping to gauge the trend. Strong upward momentum may indicate investor greed, while a downtrend points to fear.
- Stock Price Strength measures the number of stocks hitting 52-week highs versus lows, reflecting market breadth. More stocks reaching new highs signal strong optimism, while many hitting lows suggest pessimism.
- Stock Price Breadth: This compares the volume of advancing stocks versus declining stocks. A high number of advancing stocks shows widespread positive sentiment, while a higher number of declining stocks suggests market fear.
- Put and Call Options: The ratio of puts (options to sell) to calls (options to buy) reflects investor sentiment. A higher number of puts indicates fear, while more calls suggest greed and confidence in further market gains.
- Junk Bond Demand measures the demand for high-risk junk bonds. Increased demand signals a higher risk appetite, indicating greed, while lower demand shows a cautious, fear-driven market.
- Safe Haven Demand: This compares the returns of bonds to equities (stocks). When investors prefer bonds over stocks (due to lower risk), it indicates fear. On the other hand, higher returns from equities compared to bonds reflect a greed-driven market seeking higher returns.
How Does the Fear and Greed Index Work?
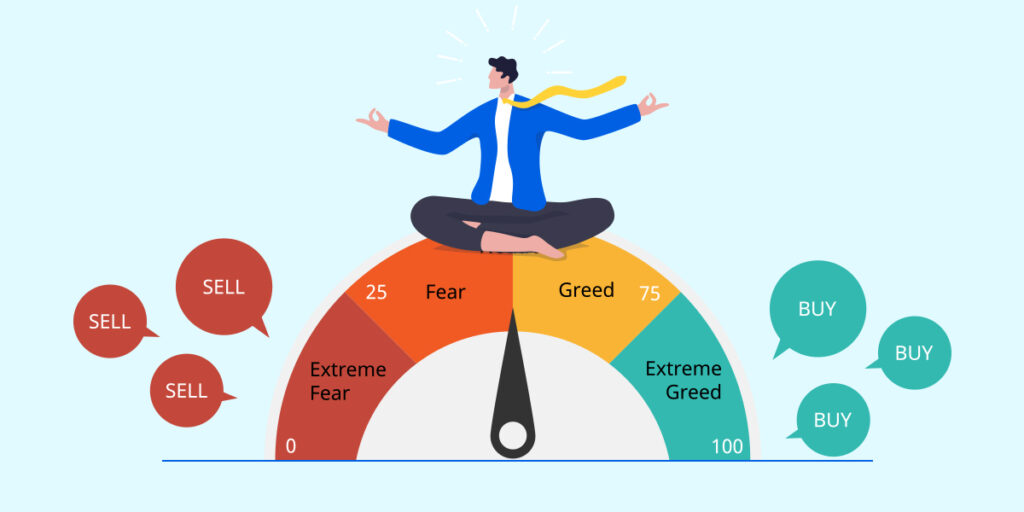
The Fear and Greed Index (FGI) measures market sentiment by tracking various factors that show investors’ feelings. It uses a scale from 0 to 100, where extreme fear represents a score of 0 and extreme greed represents a score of 100. This index helps you understand whether the market is leaning toward fear or greed, which can influence investment decisions.
Scoring Mechanism
The scoring mechanism is:
- Scale: The index ranges from 0 to 100. A score of 0 highlights extreme fear, while 100 shows extreme greed. The midpoint, 50, represents a neutral sentiment.
- Midpoint (50): A score of 50 suggests that the market sentiment is neutral, with no strong feeling of fear or greed. Investors are neither overly optimistic nor pessimistic.
Interpretation of Scores
Now, here’s how you can interpret the scores:
- Extreme Fear (0-25): When the Fear and Greed Index falls into this range, it could signal market undervaluation. This may present potential buying opportunities, as prices might be lower than their true value.
- Neutral (26-50): Scores in this range indicate a balanced market sentiment. The market is neither overly fearful nor greedy, showing a more stable investment environment.
- Extreme Greed (51-100): When the index falls into this range, it suggests that the market may be overvalued. Investors could be driven by excessive optimism, which often leads to the risk of a market correction.
Market Mood Index (MMI) in India
The Market Mood Index (MMI) is a tool similar to the FGI that tracks the sentiment of the Indian stock market, similar to the FGI, but tailored specifically for the Indian market and tracks local indicators, offering insights into investors’ feelings about India’s market direction.
Overview of MMI
The MMI focuses on understanding the mood of the Indian stock market, using indicators that are relevant to the country’s economy. It is designed to give investors a clearer picture of market sentiment within the Indian context, offering an alternative to global sentiment indicators like the Fear and Greed Index.
It examines various market indicators to gauge whether the Indian stock market sentiment is overly fearful or greedy, helping you make informed decisions.
Key Components
The MMI comprises several key components, each offering valuable insights into the Indian market.
- Nifty and Sensex Trends: These are India’s benchmark stock indices, representing the performance of the largest and most influential companies. Tracking these helps understand the broader market sentiment.
- FII/DII Flows: FII (Foreign Institutional Investors) and DII (Domestic Institutional Investors) are major players in the Indian stock market. Their buying and selling activities can signal market trends. Watching these flows provides insight into how institutional investors feel about market conditions.
- Rupee Strength: The performance of the Indian Rupee against other major currencies is another important indicator. A stronger Rupee often signals confidence in the Indian economy, while a weaker Rupee could indicate concerns.
Importance of Understanding Market Sentiment
Tools like the Fear and Greed Index and Market Mood Index can help you navigate market emotions and make smarter choices. Here’s how:
Impact on Investment Decisions
Fear and greed are strong emotions that can significantly influence buying and selling in the stock market.
- Fear often leads to panic selling, where investors may sell off assets at lower prices due to concerns about potential losses.
- Greed can lead to overbuying, where investors push prices too high in the hope of greater returns without considering underlying fundamentals.
Both emotions create distortions, causing assets to be overvalued or undervalued. For example, when fear dominates, stocks can be undervalued, making them a good buy. On the other hand, excessive greed can push stock prices above their true value, leading to a potential bubble.
Timing the Market
Tools such as the Fear and Greed Index and Market Mood Index help you identify ideal entry and exit points.
- Stock prices may be low when the market is overly fearful, presenting potential buying opportunities.
- When the market is overly greedy, it might be time to sell, as prices could be too high to sustain in the long term.
How to Use the Fear and Greed Index in Trading?
The FGI can be a helpful tool for traders by offering insights into market sentiment. Here’s how you can use it effectively:
Identifying Overbought or Oversold Conditions
The Fear and Greed Index helps you spot when the market may be overbought (when prices are too high) or oversold (when prices are too low).
- Extreme Fear: When the Fear and Greed Index shows extreme fear, it often signals that the market might be oversold, which could present buying opportunities. This is when prices may be lower than they should be, making stocks potentially undervalued.
- Extreme Greed: Conversely, the market might be overheated when the index indicates extreme greed. This could signal that prices are too high, and a market correction (a downward price adjustment) might occur. In this case, it may be wise to consider selling or reducing exposure.
Portfolio Rebalancing
You can use the FGI to guide your portfolio rebalancing.
- If the market sentiment shows extreme fear, you may want to increase your exposure to undervalued stocks.
- If the sentiment is leaning toward extreme greed, you might consider reducing your stock holdings or diversifying into other assets to protect against potential market downturns.
- Adjust asset allocation based on prevailing market sentiment.
Advantages of the Fear and Greed Index
The Fear and Greed Index provides an easy way to gauge market sentiment, distilling complex data into a single metric. Some of its benefits include:
- Simplifies complex market data into a single sentiment metric: FGI aggregates various market indicators, offering an easy-to-understand snapshot of overall market sentiment.
- Assists in countering emotional bias during trading decisions: By highlighting the prevailing market sentiment, it helps you avoid making decisions that are based on fear or greed, promoting rational investing.
- Enhances predictive accuracy for market trends: The FGI helps identify potential market reversals by observing shifts in sentiment, aiding you in predicting market movements more accurately.
Risks and Limitations
While the Fear and Greed Index can be a beneficial tool, it has its limitations, including:
- May not account for macroeconomic or geopolitical factors: The FGI focuses primarily on market sentiment and doesn’t incorporate broader economic or political events, which can significantly impact stock prices.
- Cannot predict black swan events (unforeseen disruptions): FGI is not designed to forecast rare, unpredictable events that can drastically affect markets.
- Should be used in conjunction with other analysis tools: For a well-rounded investment strategy, it’s essential to pair FGI with other stock market indicators and analyses to account for a wider range of factors influencing the market.
The Bottom Line
Tracking market sentiment through tools like the Fear and Greed Index (FGI) and the Market Mood Index (MMI) provides valuable insights into market behaviour. These indicators help you understand emotional trends in the market, enabling better timing of your investment decisions.
However, relying solely on sentiment isn’t enough. Disciplined investing requires focusing on data, fundamentals, and long-term goals rather than reacting emotionally to short-term market shifts.
Looking to diversify globally? Invest in US stocks from India with Appreciate and access world-class companies for long-term compounding growth. Download the app now!
FAQs About Fear and Greed Index
What is the Fear and Greed Index, and how is it calculated?
The fear and greed index measures market sentiment by analysing volatility, demand for safe-haven assets, and stock price momentum. It allocated a score from 0 to 100, with lower values indicating fear and higher values showing greed. This index helps investors assess the emotional state of the market.
How does market sentiment affect stock prices?
Market sentiment influences stock prices by driving buying or selling decisions. In a “fear” phase, investors tend to sell stocks, leading to price drops, while in a “greed” phase, increased buying often drives prices higher. Tools like the fear and greed index chart and market mood index chart provide visual insights into these trends.
Is the Fear and Greed Index reliable for long-term investing?
The fear and greed index is well-suited for understanding short-term market sentiment indicators than long-term investing. Consider pairing it with fundamentals like earnings, valuations, and growth prospects for a more comprehensive view.
What are the main differences between FGI and MMI?
The fear and greed index (FGI) focuses on global market sentiment, while the market mood index (MMI) is tailored to Indian markets. The Fear and Greed Index India tracks broader international sentiment, whereas the Market Mood Index India captures the behaviour of Indian investors.
Can the Fear and Greed Index predict market crashes?
While the fear and greed index highlights extreme fear or greed, it cannot directly predict market crashes. However, persistent high greed levels may signal overvalued markets, while extreme fear can indicate undervaluation, offering cues for cautious decision-making.
Disclaimer: Investments in securities markets are subject to market risks. Read all the related documents carefully before investing. The securities quoted are exemplary and are not recommendatory.


